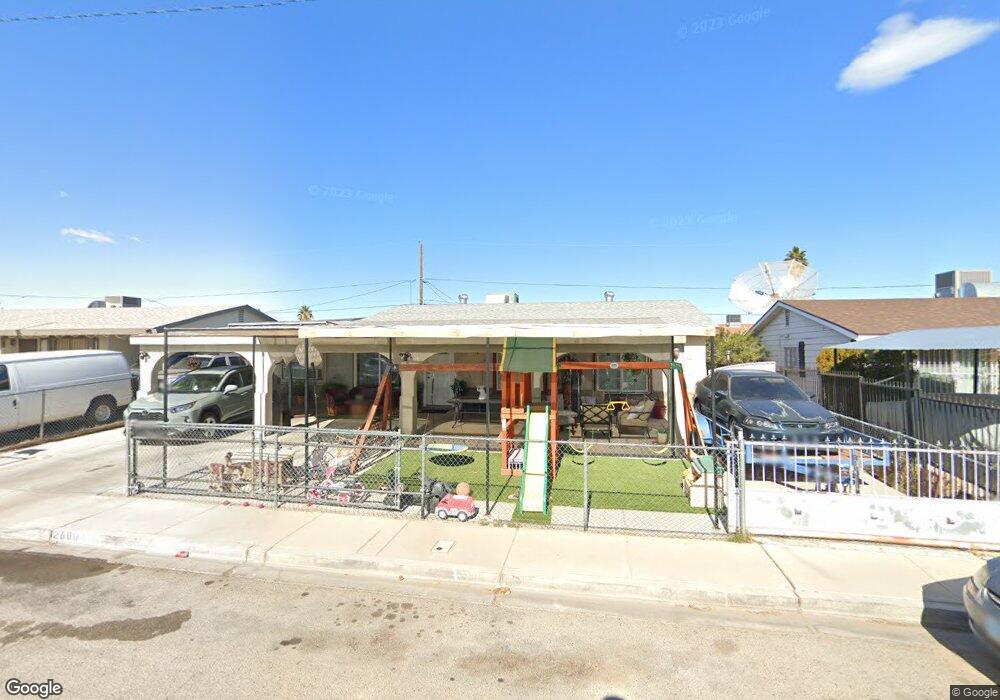
2600 Lincoln Ave North Las Vegas, NV 89030
Downtown North Las Vegas NeighborhoodEstimated Value: $291,000 - $404,000
4
Beds
2
Baths
1,448
Sq Ft
$230/Sq Ft
Est. Value
About This Home
This home is located at 2600 Lincoln Ave, North Las Vegas, NV 89030 and is currently estimated at $333,364, approximately $230 per square foot. 2600 Lincoln Ave is a home located in Clark County with nearby schools including Lincoln Elementary School, Jim Bridger Middle School, and Canyon Springs High School And The Leadership And.
Ownership History
Date
Name
Owned For
Owner Type
Purchase Details
Closed on
Sep 24, 2003
Sold by
Delatorre Maria Esthela
Bought by
Delatorre Alberto
Current Estimated Value
Home Financials for this Owner
Home Financials are based on the most recent Mortgage that was taken out on this home.
Original Mortgage
$118,736
Outstanding Balance
$54,816
Interest Rate
6.17%
Mortgage Type
FHA
Estimated Equity
$278,548
Purchase Details
Closed on
Sep 22, 2003
Sold by
Duckett John W and Duckett Elda Marceil
Bought by
Delatorre Alberto
Home Financials for this Owner
Home Financials are based on the most recent Mortgage that was taken out on this home.
Original Mortgage
$118,736
Outstanding Balance
$54,816
Interest Rate
6.17%
Mortgage Type
FHA
Estimated Equity
$278,548
Purchase Details
Closed on
Mar 21, 1996
Sold by
Duckett John W and Duckett Elda Marceil
Bought by
Duckett John W and Duckett Elda Marceil
Create a Home Valuation Report for This Property
The Home Valuation Report is an in-depth analysis detailing your home's value as well as a comparison with similar homes in the area
Home Values in the Area
Average Home Value in this Area
Purchase History
| Date | Buyer | Sale Price | Title Company |
|---|---|---|---|
| Delatorre Alberto | -- | Old Republic Title Co Of Ne | |
| Delatorre Alberto | $120,600 | Old Republic Title Co Of Ne | |
| Duckett John W | -- | -- |
Source: Public Records
Mortgage History
| Date | Status | Borrower | Loan Amount |
|---|---|---|---|
| Open | Delatorre Alberto | $118,736 |
Source: Public Records
Tax History Compared to Growth
Tax History
| Year | Tax Paid | Tax Assessment Tax Assessment Total Assessment is a certain percentage of the fair market value that is determined by local assessors to be the total taxable value of land and additions on the property. | Land | Improvement |
|---|---|---|---|---|
| 2025 | $918 | $47,719 | $23,450 | $24,269 |
| 2024 | $892 | $47,719 | $23,450 | $24,269 |
| 2023 | $892 | $42,335 | $25,200 | $17,135 |
| 2022 | $777 | $37,532 | $21,350 | $16,182 |
| 2021 | $720 | $35,174 | $19,250 | $15,924 |
| 2020 | $665 | $33,796 | $17,500 | $16,296 |
| 2019 | $623 | $30,532 | $14,000 | $16,532 |
| 2018 | $595 | $27,785 | $11,550 | $16,235 |
| 2017 | $893 | $26,629 | $9,800 | $16,829 |
| 2016 | $558 | $24,330 | $6,650 | $17,680 |
| 2015 | $556 | $23,096 | $5,250 | $17,846 |
| 2014 | $540 | $19,546 | $3,850 | $15,696 |
Source: Public Records
Map
Nearby Homes
- 2528 E Brooks Ave
- 2624 E Brooks Ave
- 3229 Figler Ct
- 3244 Figler Ct
- 2810 Equador Ct
- 3204 Crawford St
- 0 E Piper Ave
- 3008 Saint George St Unit F
- 3008 Saint George St Unit B
- 2100 E Piper Ave
- 00 Concord
- 2 Reverend Wilson
- 02 Reverend Wilson
- 0 Orleans Unit 2671878
- 2821 Bassler St
- 2825 Caney St
- 3405 Civic Center Dr Unit E
- 2100 Dogwood Ave
- 0 Plymouth Brooks
- 2112 Sun Ave Unit J
- 2604 Lincoln Ave
- 2532 Lincoln Ave
- 2608 Lincoln Ave
- 2605 Harewood Ave
- 2533 Harewood Ave
- 2528 Lincoln Ave
- 2609 Harewood Ave
- 2529 Harewood Ave
- 2605 Lincoln Ave Unit 2D2
- 2533 Lincoln Ave Unit 2C
- 2612 Lincoln Ave
- 2612 Lincoln Ave
- 2524 Lincoln Ave Unit C
- 2609 Lincoln Ave
- 2529 Lincoln Ave
- 2615 Harewood Ave
- 2525 Harewood Ave Unit 2C
- 2525 E Lincoln Ave