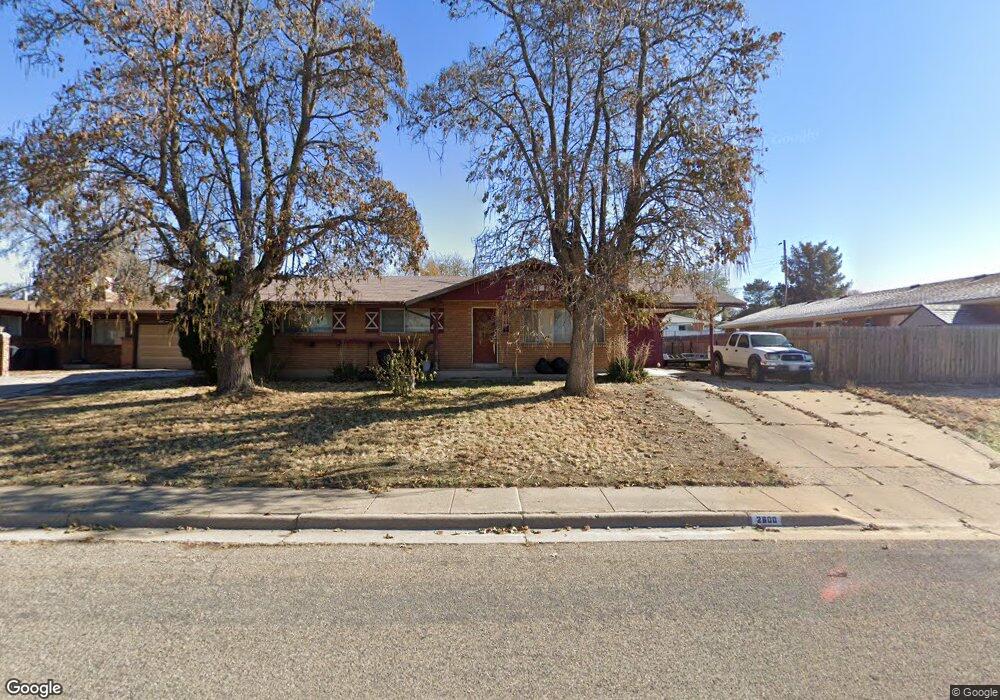
2600 N 275 W Clearfield, UT 84015
Estimated Value: $369,000 - $412,000
5
Beds
2
Baths
2,468
Sq Ft
$157/Sq Ft
Est. Value
About This Home
This home is located at 2600 N 275 W, Clearfield, UT 84015 and is currently estimated at $388,193, approximately $157 per square foot. 2600 N 275 W is a home located in Davis County with nearby schools including Fremont School, Sunset Junior High School, and Northridge High School.
Ownership History
Date
Name
Owned For
Owner Type
Purchase Details
Closed on
Sep 15, 2007
Sold by
Blake Preston
Bought by
Blake Jason R
Current Estimated Value
Home Financials for this Owner
Home Financials are based on the most recent Mortgage that was taken out on this home.
Original Mortgage
$142,000
Outstanding Balance
$89,953
Interest Rate
6.67%
Mortgage Type
Purchase Money Mortgage
Estimated Equity
$298,240
Purchase Details
Closed on
Oct 19, 2005
Sold by
Blake Ashley S
Bought by
Blake Preston
Purchase Details
Closed on
Jun 23, 2005
Sold by
Pena Zachary
Bought by
Blake Ashley S and Blake Preston
Home Financials for this Owner
Home Financials are based on the most recent Mortgage that was taken out on this home.
Original Mortgage
$24,180
Interest Rate
5.13%
Mortgage Type
Stand Alone Second
Purchase Details
Closed on
Apr 20, 2005
Sold by
Pena Mack
Bought by
Pena Zachary
Create a Home Valuation Report for This Property
The Home Valuation Report is an in-depth analysis detailing your home's value as well as a comparison with similar homes in the area
Home Values in the Area
Average Home Value in this Area
Purchase History
| Date | Buyer | Sale Price | Title Company |
|---|---|---|---|
| Blake Jason R | -- | Inwest Title Services Inc | |
| Blake Preston | -- | -- | |
| Blake Ashley S | -- | Lincoln Title Ins Agency | |
| Pena Zachary | -- | None Available |
Source: Public Records
Mortgage History
| Date | Status | Borrower | Loan Amount |
|---|---|---|---|
| Open | Blake Jason R | $142,000 | |
| Previous Owner | Blake Ashley S | $24,180 | |
| Previous Owner | Blake Ashley S | $96,720 |
Source: Public Records
Tax History Compared to Growth
Tax History
| Year | Tax Paid | Tax Assessment Tax Assessment Total Assessment is a certain percentage of the fair market value that is determined by local assessors to be the total taxable value of land and additions on the property. | Land | Improvement |
|---|---|---|---|---|
| 2025 | $1,762 | $212,850 | $75,338 | $137,512 |
| 2024 | $1,568 | $193,600 | $72,004 | $121,596 |
| 2023 | $1,466 | $331,000 | $114,921 | $216,079 |
| 2022 | $1,810 | $191,400 | $65,625 | $125,775 |
| 2021 | $1,483 | $260,000 | $71,205 | $188,795 |
| 2020 | $1,255 | $224,000 | $60,172 | $163,828 |
| 2019 | $1,160 | $214,000 | $75,615 | $138,385 |
| 2018 | $992 | $186,000 | $60,427 | $125,573 |
| 2016 | $763 | $80,080 | $28,576 | $51,504 |
| 2015 | $1,064 | $72,380 | $28,576 | $43,804 |
| 2014 | $604 | $66,807 | $28,539 | $38,268 |
| 2013 | -- | $70,851 | $23,265 | $47,586 |
Source: Public Records
Map
Nearby Homes
- 244 W 2575 N
- 2632 2125 W
- 2622 2125 W
- 2622 N 175 W
- 350 W 2575 N
- 389 W 2575 N
- 428 W 2650 N
- 2512 N 475 W
- 480 W 2650 N
- 484 W 2650 N
- 2635 N 500 W Unit 45
- 2593 N 500 W Unit 56
- 2612 N 525 W
- 5902 S 1900 W
- 2486 N 690 W
- 2177 N 450 W
- 2101 N Main St Unit 205
- 2101 N Main St Unit 203
- 2101 N Main St Unit 409
- 2382 N 770 W