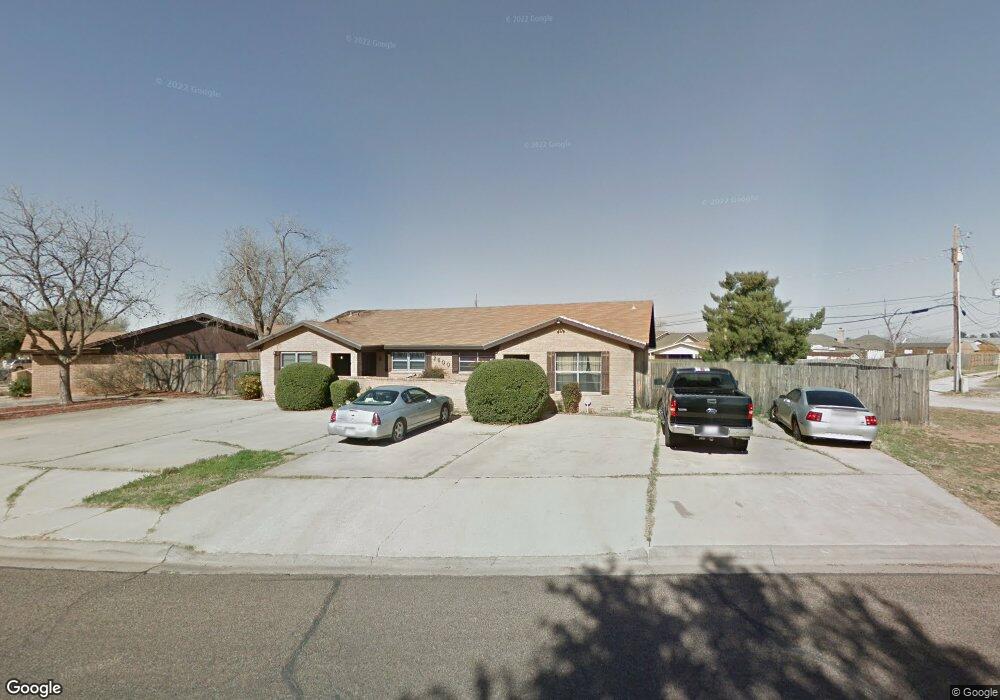
2600 N Pecos St Unit B Midland, TX 79705
Estimated Value: $154,330 - $234,000
--
Bed
--
Bath
1,245
Sq Ft
$158/Sq Ft
Est. Value
About This Home
This home is located at 2600 N Pecos St Unit B, Midland, TX 79705 and is currently estimated at $196,833, approximately $158 per square foot. 2600 N Pecos St Unit B is a home located in Midland County with nearby schools including Fannin Elementary School, San Jacinto Junior High School, and Midland High School.
Ownership History
Date
Name
Owned For
Owner Type
Purchase Details
Closed on
Sep 29, 2011
Sold by
Harrison Roy John
Bought by
Ellis Randolph and Ellis Marjorie
Current Estimated Value
Purchase Details
Closed on
Apr 6, 2004
Sold by
Dotco Distributors Inc
Bought by
Ellis Randolph
Purchase Details
Closed on
Aug 11, 2003
Sold by
Secretary Of Hud
Bought by
Ellis Randolph
Purchase Details
Closed on
Aug 1, 2003
Bought by
Ellis Randolph
Purchase Details
Closed on
Sep 30, 2002
Sold by
First American Bank Texas Ssb
Bought by
Ellis Randolph
Purchase Details
Closed on
Feb 8, 2002
Sold by
Williamson Kurt Alan
Bought by
Ellis Randolph
Purchase Details
Closed on
Feb 2, 1989
Bought by
Ellis Randolph
Purchase Details
Closed on
Jan 1, 1989
Bought by
Ellis Randolph
Purchase Details
Closed on
Jan 24, 1978
Bought by
Ellis Randolph
Create a Home Valuation Report for This Property
The Home Valuation Report is an in-depth analysis detailing your home's value as well as a comparison with similar homes in the area
Home Values in the Area
Average Home Value in this Area
Purchase History
| Date | Buyer | Sale Price | Title Company |
|---|---|---|---|
| Ellis Randolph | -- | Lone Star Abstract & Titl | |
| Ellis Randolph | -- | -- | |
| Ellis Randolph | -- | -- | |
| Ellis Randolph | -- | -- | |
| Ellis Randolph | -- | -- | |
| Ellis Randolph | -- | -- | |
| Ellis Randolph | -- | -- | |
| Ellis Randolph | -- | -- | |
| Ellis Randolph | -- | -- |
Source: Public Records
Tax History Compared to Growth
Tax History
| Year | Tax Paid | Tax Assessment Tax Assessment Total Assessment is a certain percentage of the fair market value that is determined by local assessors to be the total taxable value of land and additions on the property. | Land | Improvement |
|---|---|---|---|---|
| 2025 | $1,980 | $127,870 | $9,410 | $118,460 |
| 2024 | $1,982 | $130,540 | $9,410 | $121,130 |
| 2023 | $2,100 | $140,140 | $9,410 | $130,730 |
| 2022 | $2,253 | $144,180 | $9,410 | $134,770 |
| 2021 | $2,455 | $140,910 | $9,410 | $131,500 |
| 2020 | $2,463 | $142,130 | $9,410 | $132,720 |
| 2019 | $2,691 | $142,130 | $9,410 | $132,720 |
| 2018 | $2,518 | $129,490 | $9,410 | $120,080 |
| 2017 | $2,438 | $125,410 | $9,410 | $116,000 |
| 2016 | $2,213 | $113,590 | $9,410 | $104,180 |
| 2015 | -- | $113,590 | $9,410 | $104,180 |
| 2014 | -- | $108,450 | $0 | $0 |
Source: Public Records
Map
Nearby Homes
- 2702 N Pecos St Unit A & B
- 6 Lafayette Place
- 7 Lafayette Place
- 307 W Dormard Ave
- 806 Stanolind Ave
- 705 Melton Alley
- 716 Melton Alley
- 907 Shirley Ct
- 501 W Scharbauer Dr Unit 28
- 704 Shell Ave
- 2113 Bryant St
- 2109 Bryant St
- 2105 Bryant St
- 600 Liddon Ave Unit 80
- 2101 Bryant St
- 1207 W Pecan Ave
- 1209 W Pecan Ave
- 800 Other Ave
- 1404 W Pecan Ave
- 1906 N D St
- 2600 N Pecos St Unit A
- 2602 N Pecos St Unit B
- 2602 N Pecos St Unit A
- 425 W Pine Ave
- 422 W Pecan Ave Unit D
- 422 W Pecan Ave Unit C
- 422 W Pecan Ave Unit B
- 422 W Pecan Ave Unit A
- 422 W Pecan Ave
- 701 W Pine Ave
- 423 W Pine Ave
- 703 W Pine Ave
- 2700 N Pecos St
- 2700 N Pecos St Unit A
- 2700 N Pecos St Unit B
- 421 W Pine Ave
- 420 W Pecan Ave Unit A
- 420 W Pecan Ave Unit B
- 446 W Pine Ave
- 444 W Pine Ave