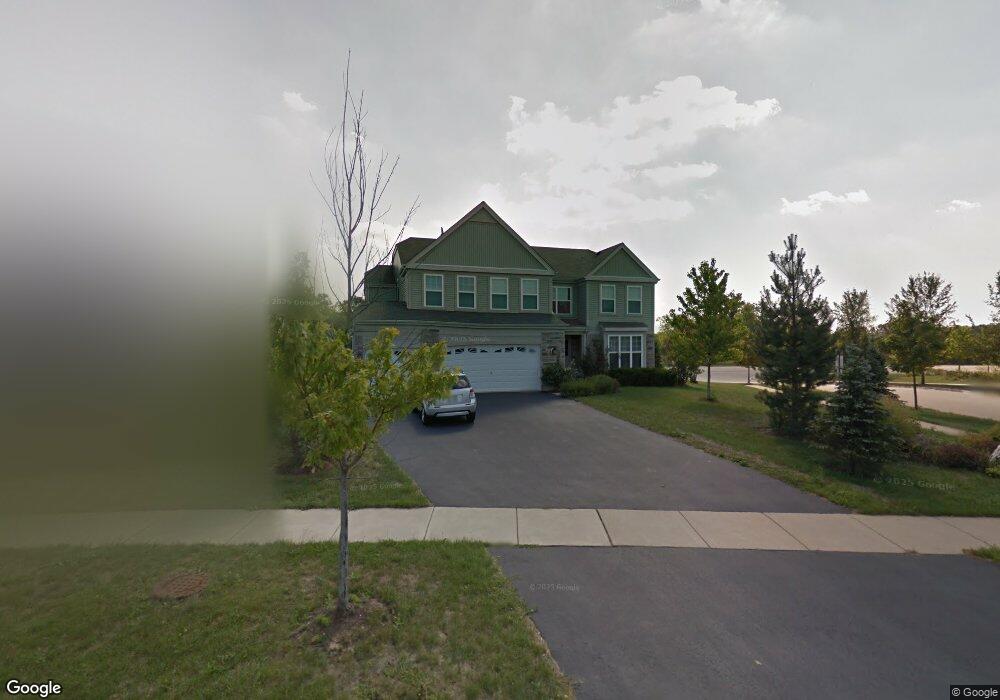
2600 N Wisteria Ct Port Barrington, IL 60010
Slocum Lake NeighborhoodEstimated Value: $478,000 - $600,310
4
Beds
3
Baths
3,318
Sq Ft
$162/Sq Ft
Est. Value
About This Home
This home is located at 2600 N Wisteria Ct, Port Barrington, IL 60010 and is currently estimated at $538,578, approximately $162 per square foot. 2600 N Wisteria Ct is a home located in Lake County with nearby schools including Cotton Creek School, Matthews Middle School, and Wauconda High School.
Ownership History
Date
Name
Owned For
Owner Type
Purchase Details
Closed on
Feb 28, 2019
Sold by
Crha Susan
Bought by
Urban Erik and Urban Jessica
Current Estimated Value
Home Financials for this Owner
Home Financials are based on the most recent Mortgage that was taken out on this home.
Original Mortgage
$252,000
Outstanding Balance
$221,551
Interest Rate
4.4%
Mortgage Type
New Conventional
Estimated Equity
$317,027
Purchase Details
Closed on
Mar 25, 2015
Sold by
Crha Susan and Urban Gregory A
Bought by
Crha Susan
Purchase Details
Closed on
Jun 18, 2014
Sold by
Crha Susan
Bought by
Crha Susan and Urban Gregory A
Purchase Details
Closed on
May 27, 2005
Sold by
Deer Grove Llc
Bought by
Urban George
Home Financials for this Owner
Home Financials are based on the most recent Mortgage that was taken out on this home.
Original Mortgage
$112,000
Interest Rate
4.87%
Mortgage Type
Fannie Mae Freddie Mac
Create a Home Valuation Report for This Property
The Home Valuation Report is an in-depth analysis detailing your home's value as well as a comparison with similar homes in the area
Home Values in the Area
Average Home Value in this Area
Purchase History
| Date | Buyer | Sale Price | Title Company |
|---|---|---|---|
| Urban Erik | $280,000 | Attorneys Title Guaranty Fun | |
| Crha Susan | -- | None Available | |
| Crha Susan | -- | None Available | |
| Urban George | $457,500 | First American Title Ins Co |
Source: Public Records
Mortgage History
| Date | Status | Borrower | Loan Amount |
|---|---|---|---|
| Open | Urban Erik | $252,000 | |
| Previous Owner | Urban George | $112,000 |
Source: Public Records
Tax History Compared to Growth
Tax History
| Year | Tax Paid | Tax Assessment Tax Assessment Total Assessment is a certain percentage of the fair market value that is determined by local assessors to be the total taxable value of land and additions on the property. | Land | Improvement |
|---|---|---|---|---|
| 2024 | $10,638 | $146,442 | $27,473 | $118,969 |
| 2023 | $9,695 | $133,859 | $25,112 | $108,747 |
| 2022 | $9,695 | $109,644 | $34,235 | $75,409 |
| 2021 | $9,262 | $103,604 | $32,349 | $71,255 |
| 2020 | $8,950 | $98,746 | $30,832 | $67,914 |
| 2019 | $7,855 | $93,324 | $29,139 | $64,185 |
| 2018 | $11,683 | $124,199 | $35,986 | $88,213 |
| 2017 | $11,666 | $122,763 | $35,570 | $87,193 |
| 2016 | $11,097 | $116,253 | $33,684 | $82,569 |
| 2015 | $10,685 | $106,723 | $30,923 | $75,800 |
| 2014 | $9,463 | $99,494 | $21,663 | $77,831 |
| 2012 | $9,183 | $98,280 | $20,728 | $77,552 |
Source: Public Records
Map
Nearby Homes
- 26605 N Brooks St
- 26769 N Genesee St
- 26822 N Ada St
- 26814 N Genesee St
- 26824 N Poplar St
- 28373 W Main St
- 28379 W Main St
- 28490 W Main St
- 26958 N Ellen St
- 28406 W Park Ave
- 1102 Noble Pkwy
- 28965 W Roberts Rd
- 29460 Roberts Rd
- 515 Normandy Ln
- 26215 N Geraldine Ln
- 327 Garrison Cir
- 108 Poplar St
- 27125 N Williams Park Rd
- 138 Eastwood Ave
- 27405 N Roberts Ln
- 2604 N Wisteria Ct
- 2608 N Wisteria Ct
- 2633 N Wisteria Ct
- 2633 N Wisteria Way
- 2632 N Wisteria Way
- 2637 N Wisteria Way
- 2612 N Wisteria Ct
- 2636 N Wisteria Way
- 2628 N Wisteria Ct
- 2703 N Wisteria Way
- 2624 Wisteria Ct
- 2616 N Wisteria Ct
- 2624 N Wisteria Ct
- 2704 N Wisteria Way
- 2620 N Wisteria Ct
- 2700 N Wisteria Way
- 2707 N Wisteria Way
- 2708 N Wisteria Way
- 2711 N Wisteria Way
- 28325 W Long Ln