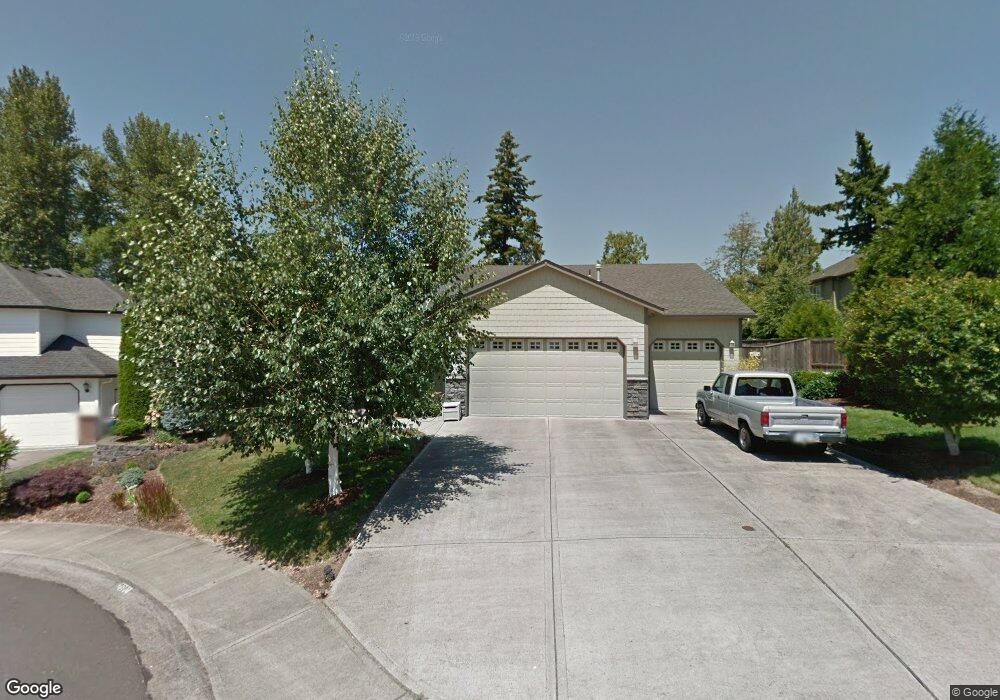
2600 NE 173rd Cir Ridgefield, WA 98642
Estimated Value: $738,000 - $787,000
4
Beds
3
Baths
2,364
Sq Ft
$322/Sq Ft
Est. Value
About This Home
This home is located at 2600 NE 173rd Cir, Ridgefield, WA 98642 and is currently estimated at $762,063, approximately $322 per square foot. 2600 NE 173rd Cir is a home located in Clark County with nearby schools including Ridgefield High School, The Gardner School of Arts & Sciences, and Cedar Tree Classical Christian School.
Ownership History
Date
Name
Owned For
Owner Type
Purchase Details
Closed on
Oct 13, 2011
Sold by
Schaumberg Teresita Nanida
Bought by
Schaumberg Teresita
Current Estimated Value
Purchase Details
Closed on
Jun 18, 2003
Sold by
Garr General Construction Inc
Bought by
Schaumberg Gene D and Schaumberg Teresita
Home Financials for this Owner
Home Financials are based on the most recent Mortgage that was taken out on this home.
Original Mortgage
$127,400
Interest Rate
5.53%
Mortgage Type
Purchase Money Mortgage
Purchase Details
Closed on
Aug 28, 2002
Sold by
Ejw Inc
Bought by
Garr General Construction Inc
Home Financials for this Owner
Home Financials are based on the most recent Mortgage that was taken out on this home.
Original Mortgage
$216,000
Interest Rate
6.29%
Mortgage Type
Construction
Create a Home Valuation Report for This Property
The Home Valuation Report is an in-depth analysis detailing your home's value as well as a comparison with similar homes in the area
Home Values in the Area
Average Home Value in this Area
Purchase History
| Date | Buyer | Sale Price | Title Company |
|---|---|---|---|
| Schaumberg Teresita | -- | None Available | |
| Schaumberg Gene D | $277,400 | Fidelity National Title | |
| Garr General Construction Inc | $61,000 | Stewart Title |
Source: Public Records
Mortgage History
| Date | Status | Borrower | Loan Amount |
|---|---|---|---|
| Closed | Schaumberg Gene D | $127,400 | |
| Previous Owner | Garr General Construction Inc | $216,000 |
Source: Public Records
Tax History Compared to Growth
Tax History
| Year | Tax Paid | Tax Assessment Tax Assessment Total Assessment is a certain percentage of the fair market value that is determined by local assessors to be the total taxable value of land and additions on the property. | Land | Improvement |
|---|---|---|---|---|
| 2025 | $6,383 | $742,488 | $235,200 | $507,288 |
| 2024 | $6,084 | $670,007 | $235,200 | $434,807 |
| 2023 | $6,112 | $690,297 | $240,100 | $450,197 |
| 2022 | $5,601 | $666,958 | $230,300 | $436,658 |
| 2021 | $5,636 | $542,844 | $137,750 | $405,094 |
| 2020 | $5,366 | $507,524 | $131,100 | $376,424 |
| 2019 | $5,332 | $489,939 | $131,100 | $358,839 |
| 2018 | $5,487 | $492,829 | $0 | $0 |
| 2017 | $4,500 | $435,484 | $0 | $0 |
| 2016 | $4,157 | $407,841 | $0 | $0 |
| 2015 | $3,944 | $361,686 | $0 | $0 |
| 2014 | -- | $333,923 | $0 | $0 |
| 2013 | -- | $318,219 | $0 | $0 |
Source: Public Records
Map
Nearby Homes
- 17704 NE 26th Ct Unit Lot 4
- 17708 NE 26th Ct Unit Lot 3
- 2503 NE 178th St
- 17711 NE 25th Ct Unit LOT 8
- 17716 NE 26th Ct
- 3609 NE 170th St
- 2217 NE 179th St Unit L22
- 3100 NE 171st St
- 3615 NE 169th Way
- 3619 NE 169th Way
- 2617 NE 166th St
- 17318 NE 19th Dr
- 2514 NE 163rd St
- 3604 170th St
- 3620 NE 168th St
- 3608 NE 170th St
- 3616 NE 168th St
- 1614 NE 172nd Cir
- 16912 NE 17th Ave
- 3608 NE 168th St
- 2604 NE 173rd Cir
- 2514 NE 173rd Cir
- 2510 NE 173rd Cir
- 0 NE 173rd Cir
- 17312 NE 27th Ave
- 2603 NE 173rd Cir
- 2513 NE 173rd Cir
- 2615 NE 175th St
- 2607 NE 173rd Cir
- 2509 NE 173rd Cir
- 2605 NE 174th St
- 2803 NE 179th St
- 2520 NE 172nd Cir
- 2602 NE 172nd Cir
- 2516 NE 172nd Cir
- 17301 NE 27th Ave
- 17313 NE 27th Ave
- 17204 NE 27th Ave
- 2619 NE 175th St
- 2612 NE 175th St