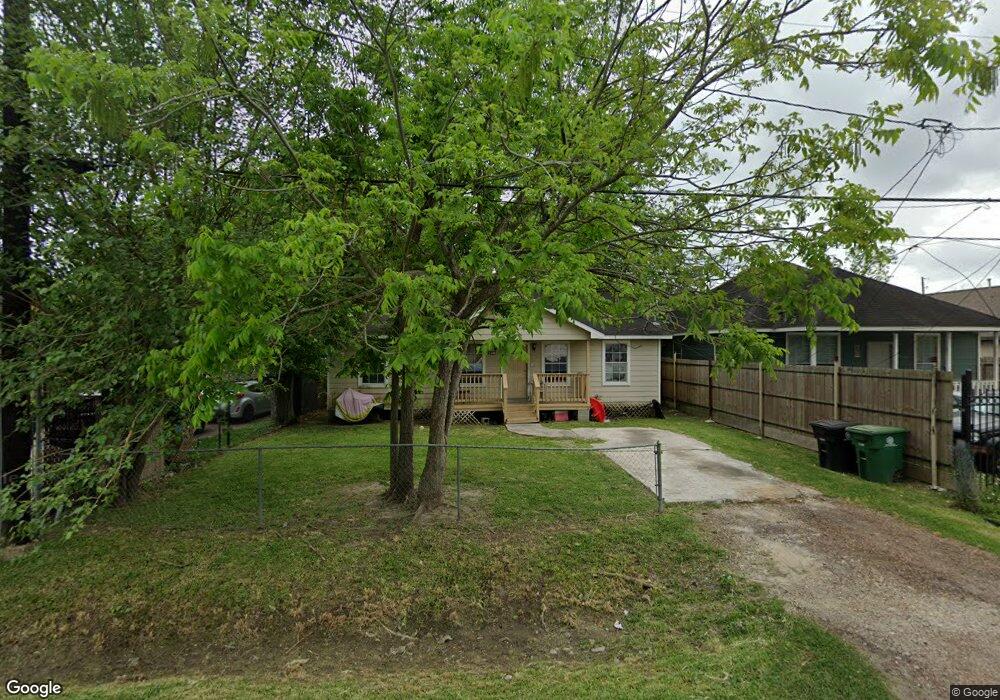
2600 Vance St Houston, TX 77093
Eastex-Jensen NeighborhoodEstimated Value: $181,000 - $235,000
3
Beds
2
Baths
1,155
Sq Ft
$176/Sq Ft
Est. Value
About This Home
This home is located at 2600 Vance St, Houston, TX 77093 and is currently estimated at $202,915, approximately $175 per square foot. 2600 Vance St is a home located in Harris County with nearby schools including Roderick R. Paige Elementary School, Key Middle, and Kashmere High School.
Ownership History
Date
Name
Owned For
Owner Type
Purchase Details
Closed on
Apr 15, 2025
Sold by
Ali Ahmad H
Bought by
Ali Omar H
Current Estimated Value
Purchase Details
Closed on
Dec 31, 2008
Sold by
National City Bank
Bought by
Ali Ahmad
Purchase Details
Closed on
Apr 1, 2008
Sold by
Venegas Enrique G and Venegas Maria D
Bought by
Lasalle Bank Na and First Franklin Mortgage Loan Trust 2007-
Purchase Details
Closed on
Nov 7, 2006
Sold by
Torres Sonia Andrea and Torres Antonio
Bought by
Venegas Enrique G and Venegas Maria D
Home Financials for this Owner
Home Financials are based on the most recent Mortgage that was taken out on this home.
Original Mortgage
$76,000
Interest Rate
6.28%
Mortgage Type
Purchase Money Mortgage
Purchase Details
Closed on
Dec 7, 2004
Sold by
Fields Rollins
Bought by
Torres Sonia Andrea
Purchase Details
Closed on
Sep 24, 2004
Sold by
Fields Rollins and Fields Mamie L
Bought by
Harris County
Create a Home Valuation Report for This Property
The Home Valuation Report is an in-depth analysis detailing your home's value as well as a comparison with similar homes in the area
Home Values in the Area
Average Home Value in this Area
Purchase History
| Date | Buyer | Sale Price | Title Company |
|---|---|---|---|
| Ali Omar H | -- | None Listed On Document | |
| Ali Ahmad | -- | North American Title Company | |
| Lasalle Bank Na | $83,426 | None Available | |
| Venegas Enrique G | -- | None Available | |
| Torres Sonia Andrea | $13,000 | -- | |
| Harris County | -- | -- |
Source: Public Records
Mortgage History
| Date | Status | Borrower | Loan Amount |
|---|---|---|---|
| Previous Owner | Venegas Enrique G | $76,000 |
Source: Public Records
Tax History Compared to Growth
Tax History
| Year | Tax Paid | Tax Assessment Tax Assessment Total Assessment is a certain percentage of the fair market value that is determined by local assessors to be the total taxable value of land and additions on the property. | Land | Improvement |
|---|---|---|---|---|
| 2025 | $2,825 | $156,047 | $62,100 | $93,947 |
| 2024 | $2,825 | $135,000 | $51,750 | $83,250 |
| 2023 | $2,825 | $138,858 | $46,575 | $92,283 |
| 2022 | $2,951 | $134,000 | $31,050 | $102,950 |
| 2021 | $2,758 | $118,338 | $31,050 | $87,288 |
| 2020 | $2,866 | $136,049 | $31,050 | $104,999 |
| 2019 | $1,981 | $78,300 | $20,700 | $57,600 |
| 2018 | $1,981 | $78,300 | $20,700 | $57,600 |
| 2017 | $1,980 | $78,300 | $20,700 | $57,600 |
| 2016 | $1,011 | $40,000 | $13,800 | $26,200 |
| 2015 | $1,028 | $40,000 | $13,800 | $26,200 |
| 2014 | $1,028 | $40,000 | $13,800 | $26,200 |
Source: Public Records
Map
Nearby Homes
- 7307 Adelbert St
- 2516 Vaughn St
- 7305 Jensen
- 2120 Vance St
- 4008 Bennington St
- 2402 Bennington St
- 2520 E Crosstimbers St
- 2602 E Crosstimbers St
- 7617 Jensen Dr
- 2707 Lynnfield St
- 2314 Spence St
- 2710 Lynnfield St
- 6806 Schuller Rd
- 7718 Duncan St
- 2413 E Crosstimbers St
- 7722 West St
- 2821 E Crosstimbers St
- 2503 Creston Dr
- 1928 E Crosstimbers St
- 3210 Oklahoma St