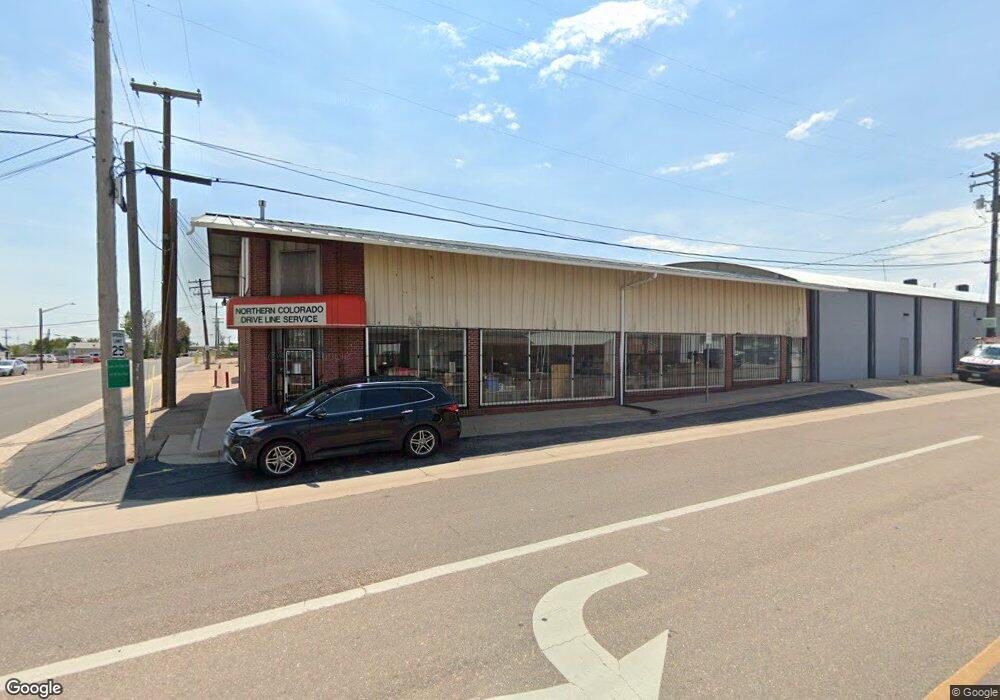
2601 7th Ave Greeley, CO 80631
Estimated Value: $1,583,243
--
Bed
--
Bath
9,550
Sq Ft
$166/Sq Ft
Est. Value
About This Home
This home is located at 2601 7th Ave, Greeley, CO 80631 and is currently priced at $1,583,243, approximately $165 per square foot. 2601 7th Ave is a home located in Weld County with nearby schools including Jackson Elementary School, Brentwood Middle School, and Greeley Central High School.
Ownership History
Date
Name
Owned For
Owner Type
Purchase Details
Closed on
Jun 17, 2019
Sold by
Whats Left Llc
Bought by
Henze Terry A
Current Estimated Value
Purchase Details
Closed on
Sep 23, 2004
Sold by
Se2 Land Llc
Bought by
Whats Left Llc
Home Financials for this Owner
Home Financials are based on the most recent Mortgage that was taken out on this home.
Original Mortgage
$562,500
Interest Rate
5.81%
Mortgage Type
Purchase Money Mortgage
Purchase Details
Closed on
Jan 22, 1997
Sold by
Daily Kristy K
Bought by
Daily Dan M
Purchase Details
Closed on
Jul 14, 1994
Sold by
Smith Ron L and Smith Debra A
Bought by
Daily Dan M and Daily Kristy K
Purchase Details
Closed on
May 14, 1993
Sold by
Vavra Benjamin J and Vavra Lorraine
Bought by
Smith Ron L and Smith Debra A
Purchase Details
Closed on
Jul 31, 1990
Sold by
Bengford Francis H and Bengford Sandra L
Bought by
Vavra Benjamin J and Vavra Lorraine
Purchase Details
Closed on
Oct 23, 1980
Create a Home Valuation Report for This Property
The Home Valuation Report is an in-depth analysis detailing your home's value as well as a comparison with similar homes in the area
Home Values in the Area
Average Home Value in this Area
Purchase History
| Date | Buyer | Sale Price | Title Company |
|---|---|---|---|
| Henze Terry A | -- | None Available | |
| Whats Left Llc | $630,000 | North American Title | |
| Daily Dan M | -- | -- | |
| Daily Dan M | $80,000 | -- | |
| Smith Ron L | $45,000 | -- | |
| Vavra Benjamin J | $25,000 | -- | |
| -- | -- | -- |
Source: Public Records
Mortgage History
| Date | Status | Borrower | Loan Amount |
|---|---|---|---|
| Previous Owner | Whats Left Llc | $562,500 |
Source: Public Records
Tax History Compared to Growth
Tax History
| Year | Tax Paid | Tax Assessment Tax Assessment Total Assessment is a certain percentage of the fair market value that is determined by local assessors to be the total taxable value of land and additions on the property. | Land | Improvement |
|---|---|---|---|---|
| 2025 | $11,398 | $139,190 | $14,630 | $124,560 |
| 2024 | $11,398 | $139,190 | $14,630 | $124,560 |
| 2023 | $10,348 | $126,560 | $15,110 | $111,450 |
| 2022 | $8,048 | $90,010 | $6,280 | $83,730 |
| 2021 | $8,414 | $90,010 | $6,280 | $83,730 |
| 2020 | $7,133 | $76,160 | $4,710 | $71,450 |
| 2019 | $7,207 | $76,160 | $4,710 | $71,450 |
| 2018 | $5,101 | $55,390 | $3,930 | $51,460 |
| 2017 | $5,117 | $55,390 | $3,930 | $51,460 |
| 2016 | $4,434 | $52,620 | $3,140 | $49,480 |
| 2015 | $4,432 | $52,620 | $3,140 | $49,480 |
| 2014 | $4,516 | $52,620 | $3,140 | $49,480 |
Source: Public Records
Map
Nearby Homes
- 2704 7th Ave
- 2706 7th Ave
- 2418 10th Ave Unit A -B
- 2400 10th Ave
- 2518 12th Avenue Ct
- 2237 10th Ave
- 2229 10th Ave
- 2130 9th Ave
- 1305 27th St
- 2107 9th Ave
- 3010 11th Ave
- 2001 5th Ave
- 3037 Lakeside Dr
- 2433 15th Avenue Ct
- 2413 15th Avenue Ct
- 3021 11th Ave Unit 13
- 2628 16th Ave
- 3125 11th Ave
- 1325 Darrell Rd Unit 1325
- 1838 8th Ave