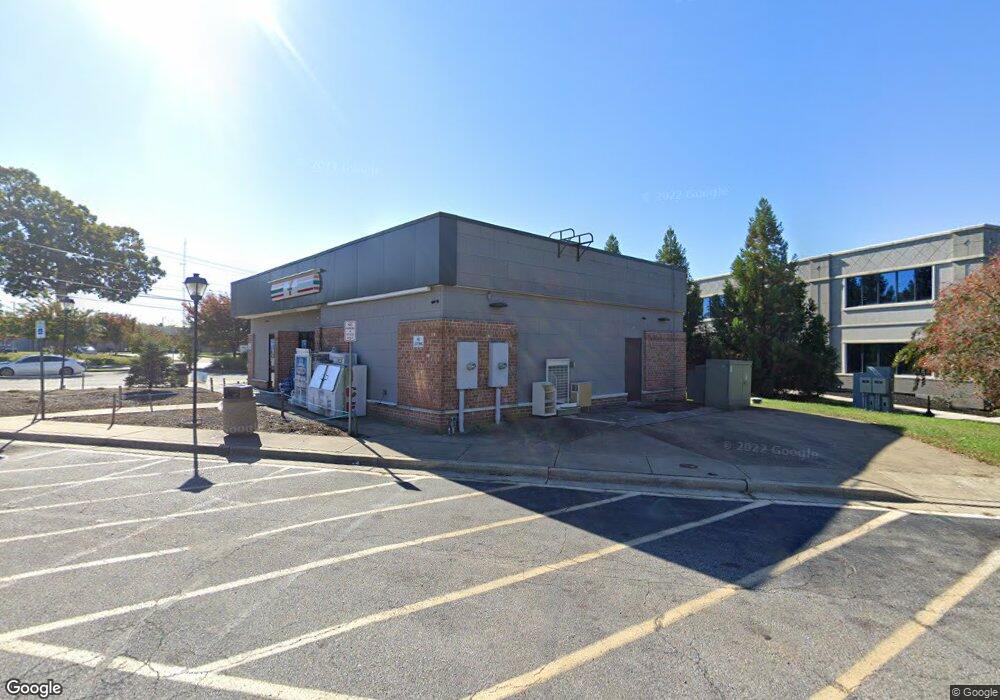
2601 Centreville Rd Centreville, MD 21617
Estimated Value: $1,468,574
--
Bed
--
Bath
2,128
Sq Ft
$690/Sq Ft
Est. Value
About This Home
This home is located at 2601 Centreville Rd, Centreville, MD 21617 and is currently estimated at $1,468,574, approximately $690 per square foot. 2601 Centreville Rd is a home located in Queen Anne's County with nearby schools including Kennard Elementary School, Centreville Middle School, and Queen Anne's County High School.
Ownership History
Date
Name
Owned For
Owner Type
Purchase Details
Closed on
Oct 8, 2020
Sold by
The Kempter Family Trust
Bought by
The Kempter Family Trust
Current Estimated Value
Purchase Details
Closed on
Jun 5, 2018
Sold by
Capitla Realty Llc
Bought by
The Kemper Family Yrust
Purchase Details
Closed on
Oct 10, 2013
Sold by
Jjc Properties Llc
Bought by
Capital Realty Llc
Purchase Details
Closed on
Jul 30, 2010
Sold by
Draco Investment Group Llc
Bought by
Jjc Properties Llc
Purchase Details
Closed on
Jul 20, 2004
Sold by
Shore Pizza Hut Inc
Bought by
Draco Investment Group Llc
Purchase Details
Closed on
Oct 2, 1989
Sold by
Z & B Brodie Family Ltd Ptnsp
Bought by
Shore Pizza Hut, Inc
Home Financials for this Owner
Home Financials are based on the most recent Mortgage that was taken out on this home.
Original Mortgage
$350,000
Interest Rate
10.16%
Create a Home Valuation Report for This Property
The Home Valuation Report is an in-depth analysis detailing your home's value as well as a comparison with similar homes in the area
Home Values in the Area
Average Home Value in this Area
Purchase History
| Date | Buyer | Sale Price | Title Company |
|---|---|---|---|
| The Kempter Family Trust | -- | None Available | |
| The Kemper Family Yrust | $1,075,000 | Grs Title Svcs Llc | |
| Capital Realty Llc | $815,000 | None Available | |
| Jjc Properties Llc | $550,000 | -- | |
| Draco Investment Group Llc | $385,000 | -- | |
| Shore Pizza Hut, Inc | $450,000 | -- |
Source: Public Records
Mortgage History
| Date | Status | Borrower | Loan Amount |
|---|---|---|---|
| Previous Owner | Shore Pizza Hut, Inc | $350,000 |
Source: Public Records
Tax History Compared to Growth
Tax History
| Year | Tax Paid | Tax Assessment Tax Assessment Total Assessment is a certain percentage of the fair market value that is determined by local assessors to be the total taxable value of land and additions on the property. | Land | Improvement |
|---|---|---|---|---|
| 2025 | $9,302 | $690,600 | $0 | $0 |
| 2024 | $8,683 | $644,600 | $361,100 | $283,500 |
| 2023 | $8,470 | $628,833 | $0 | $0 |
| 2022 | $8,258 | $613,067 | $0 | $0 |
| 2021 | $0 | $597,300 | $314,000 | $283,300 |
| 2020 | $7,393 | $593,067 | $0 | $0 |
| 2019 | $7,333 | $588,833 | $0 | $0 |
| 2018 | $7,975 | $584,600 | $457,000 | $127,600 |
| 2017 | $6,548 | $549,300 | $0 | $0 |
| 2016 | -- | $514,000 | $0 | $0 |
| 2015 | $3,756 | $478,700 | $0 | $0 |
| 2014 | $3,756 | $464,533 | $0 | $0 |
Source: Public Records
Map
Nearby Homes
- 407 S Commerce St
- 202 Ridgeview Ct
- 371 Overture Way
- 364 Overture Way
- 114 S Commerce St
- 112 S Commerce St
- 114 Bristol Ln
- 107 Overture Way
- 250 Concerto Ave
- 331 Kidwell Ave
- 104 Windsor Ave
- 142 Harmony Way
- 214 Orchestra Place
- 807 Harmony Way
- 125 Price St
- 127 Price St
- 106 Turpins Ln
- 714 Harmony Way
- 119 Watson Rd
- 704 Church Hill Rd
- 2977 4h Park Rd
- 2977 4h Park Rd
- 2615 Centreville Rd
- 2957 4h Park Rd
- 2600 Centreville Rd
- 2619 Centreville Rd
- 2543 Centreville Rd
- 2612 Centreville Rd
- 2623 Centreville Rd
- 2539 Centreville Rd
- 2540 Centreville Rd
- 2535 Centreville Rd
- 2627 Centreville Rd
- 2631 Centreville Rd
- 2940 4h Park Rd
- 255 Comet Dr
- 159 Comet Dr
- 2527 Centreville Rd
- 151 Comet Dr
- 131 Comet Dr