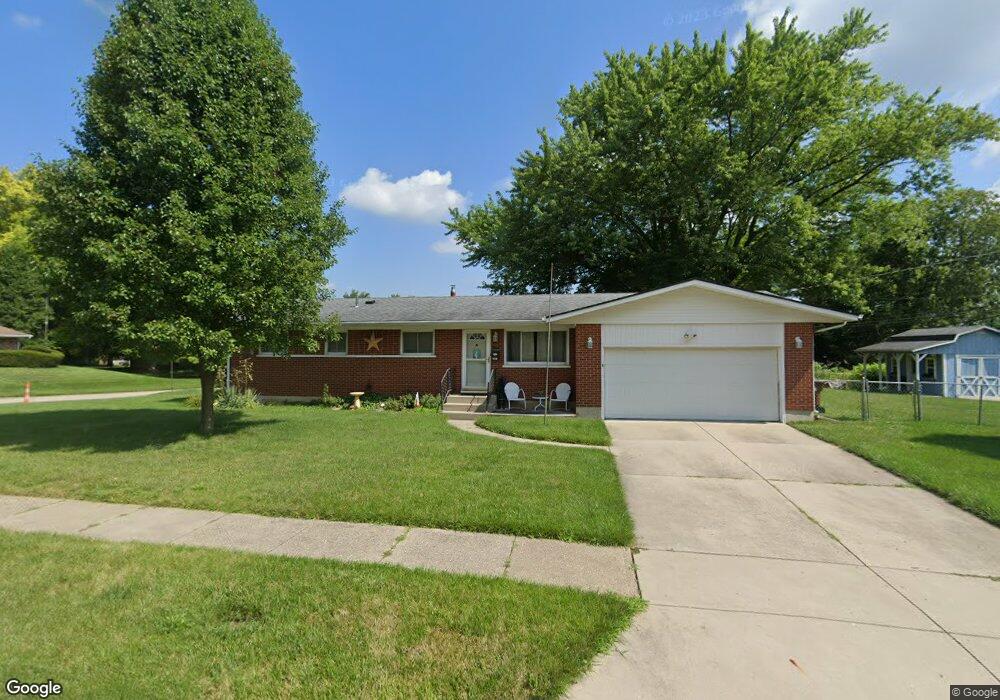
2601 Clarendon Dr Dayton, OH 45440
Estimated Value: $285,603 - $324,000
4
Beds
3
Baths
1,554
Sq Ft
$193/Sq Ft
Est. Value
About This Home
This home is located at 2601 Clarendon Dr, Dayton, OH 45440 and is currently estimated at $300,151, approximately $193 per square foot. 2601 Clarendon Dr is a home located in Montgomery County with nearby schools including Prass Elementary School, Kettering Middle School, and Kettering Fairmont High School.
Ownership History
Date
Name
Owned For
Owner Type
Purchase Details
Closed on
Jul 23, 2013
Sold by
Smith Joseph E and Smith Amy M
Bought by
Wright Susan M and Wright Jesse G
Current Estimated Value
Home Financials for this Owner
Home Financials are based on the most recent Mortgage that was taken out on this home.
Original Mortgage
$119,600
Interest Rate
3.93%
Mortgage Type
Future Advance Clause Open End Mortgage
Purchase Details
Closed on
Feb 13, 2004
Sold by
Dapice Inez E Tr
Bought by
Smith Joseph E and Smith Amy M
Home Financials for this Owner
Home Financials are based on the most recent Mortgage that was taken out on this home.
Original Mortgage
$126,540
Interest Rate
5.96%
Mortgage Type
Purchase Money Mortgage
Purchase Details
Closed on
May 24, 2001
Sold by
Dapice Inez E
Bought by
Dapice Inez E and Inez E Dapice Revocable Living Trust
Create a Home Valuation Report for This Property
The Home Valuation Report is an in-depth analysis detailing your home's value as well as a comparison with similar homes in the area
Home Values in the Area
Average Home Value in this Area
Purchase History
| Date | Buyer | Sale Price | Title Company |
|---|---|---|---|
| Wright Susan M | $149,500 | Landmark Title Agency South | |
| Smith Joseph E | $133,200 | -- | |
| Dapice Inez E | -- | -- |
Source: Public Records
Mortgage History
| Date | Status | Borrower | Loan Amount |
|---|---|---|---|
| Previous Owner | Wright Susan M | $119,600 | |
| Previous Owner | Smith Joseph E | $126,540 |
Source: Public Records
Tax History Compared to Growth
Tax History
| Year | Tax Paid | Tax Assessment Tax Assessment Total Assessment is a certain percentage of the fair market value that is determined by local assessors to be the total taxable value of land and additions on the property. | Land | Improvement |
|---|---|---|---|---|
| 2024 | $5,082 | $82,020 | $11,520 | $70,500 |
| 2023 | $5,082 | $82,020 | $11,520 | $70,500 |
| 2022 | $5,120 | $65,370 | $9,210 | $56,160 |
| 2021 | $4,735 | $65,370 | $9,210 | $56,160 |
| 2020 | $4,749 | $65,370 | $9,210 | $56,160 |
| 2019 | $4,315 | $52,490 | $9,210 | $43,280 |
| 2018 | $4,338 | $52,490 | $9,210 | $43,280 |
| 2017 | $3,995 | $52,490 | $9,210 | $43,280 |
| 2016 | $3,706 | $45,740 | $9,210 | $36,530 |
| 2015 | $3,540 | $45,740 | $9,210 | $36,530 |
| 2014 | $3,540 | $45,740 | $9,210 | $36,530 |
| 2012 | -- | $47,170 | $9,260 | $37,910 |
Source: Public Records
Map
Nearby Homes
- 4408 Glenheath Dr
- 4464 Woodner Dr
- 4533 Drayton Ct
- 2409 Burning Tree Dr
- 2648 Parklawn Dr
- 2447 Hemphill Rd
- 4210 Wallington Dr
- 4508 Rean Meadow Dr
- 4086 Glenheath Dr
- 2313 Glenheath Dr
- 4370 Wilmington Pike
- 2816 Corlington Dr
- 861 Acorn Dr
- 2841 Corlington Dr
- 3034 Sandywood Dr
- 2233 Cherry Oak Dr
- 3033 Glenmere Ct
- 3117 Swigert Rd
- 4824 Rean Meadow Dr
- 4190 Woodman Dr
- 4448 Appleton Place
- 2600 Clarendon Dr
- 2693 Clarendon Dr
- 4457 Appleton Place
- 4409 Burchdale St
- 4440 Appleton Place
- 2690 Clarendon Dr
- 4482 Appleton Place
- 4401 Burchdale St
- 4475 Appleton Place
- 4441 Appleton Place
- 2525 Clarendon Dr
- 4432 Appleton Place
- 4433 Burchdale St
- 4325 Burchdale St
- 2524 Clarendon Dr
- 4433 Appleton Place
- 2517 Clarendon Dr
- 4441 Burchdale St
- 4416 Burchdale St