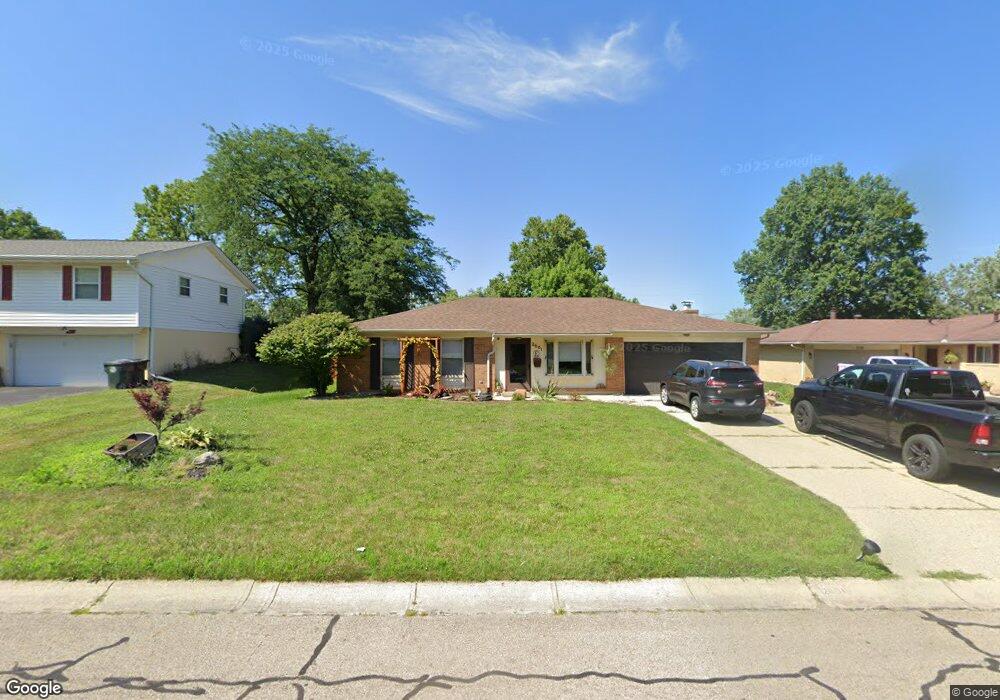
2601 Delavan Dr Dayton, OH 45459
Woodbourne-Hyde Park NeighborhoodEstimated Value: $261,000 - $276,000
3
Beds
2
Baths
1,416
Sq Ft
$188/Sq Ft
Est. Value
About This Home
This home is located at 2601 Delavan Dr, Dayton, OH 45459 and is currently estimated at $266,569, approximately $188 per square foot. 2601 Delavan Dr is a home located in Montgomery County with nearby schools including Miamisburg High School, Miami Valley Academies, and Bishop Leibold School.
Ownership History
Date
Name
Owned For
Owner Type
Purchase Details
Closed on
Dec 23, 2021
Sold by
Ball Michael R and Ball Jennifer C
Bought by
Eckley Micaha N and Eckley Jacob M
Current Estimated Value
Home Financials for this Owner
Home Financials are based on the most recent Mortgage that was taken out on this home.
Original Mortgage
$203,700
Outstanding Balance
$187,351
Interest Rate
3.11%
Mortgage Type
New Conventional
Estimated Equity
$79,218
Purchase Details
Closed on
Jul 26, 2013
Sold by
Ball Michael R and Ball Jennifer C
Bought by
Ball Michael R and Ball Jennifer C
Home Financials for this Owner
Home Financials are based on the most recent Mortgage that was taken out on this home.
Original Mortgage
$92,200
Interest Rate
3.52%
Mortgage Type
Future Advance Clause Open End Mortgage
Purchase Details
Closed on
Oct 29, 2001
Sold by
Sedlock Robert W and Sedlock Dawn S
Bought by
Ball Michael R and Mayberry Jennifer C
Home Financials for this Owner
Home Financials are based on the most recent Mortgage that was taken out on this home.
Original Mortgage
$119,200
Interest Rate
6.72%
Create a Home Valuation Report for This Property
The Home Valuation Report is an in-depth analysis detailing your home's value as well as a comparison with similar homes in the area
Home Values in the Area
Average Home Value in this Area
Purchase History
| Date | Buyer | Sale Price | Title Company |
|---|---|---|---|
| Eckley Micaha N | -- | None Listed On Document | |
| Ball Michael R | -- | Servicelink | |
| Ball Michael R | $125,500 | -- |
Source: Public Records
Mortgage History
| Date | Status | Borrower | Loan Amount |
|---|---|---|---|
| Open | Eckley Micaha N | $203,700 | |
| Previous Owner | Ball Michael R | $92,200 | |
| Previous Owner | Ball Michael R | $119,200 |
Source: Public Records
Tax History Compared to Growth
Tax History
| Year | Tax Paid | Tax Assessment Tax Assessment Total Assessment is a certain percentage of the fair market value that is determined by local assessors to be the total taxable value of land and additions on the property. | Land | Improvement |
|---|---|---|---|---|
| 2024 | $4,670 | $65,590 | $9,310 | $56,280 |
| 2023 | $4,670 | $65,590 | $9,310 | $56,280 |
| 2022 | $3,983 | $48,440 | $6,900 | $41,540 |
| 2021 | $3,758 | $48,440 | $6,900 | $41,540 |
| 2020 | $3,696 | $48,440 | $6,900 | $41,540 |
| 2019 | $3,351 | $39,770 | $6,900 | $32,870 |
| 2018 | $3,327 | $39,770 | $6,900 | $32,870 |
| 2017 | $3,308 | $39,770 | $6,900 | $32,870 |
| 2016 | $2,991 | $34,460 | $6,900 | $27,560 |
| 2015 | $2,940 | $34,460 | $6,900 | $27,560 |
| 2014 | $2,940 | $34,460 | $6,900 | $27,560 |
| 2012 | -- | $41,850 | $10,780 | $31,070 |
Source: Public Records
Map
Nearby Homes
- 2560 Delavan Dr
- 488 Crossing Ln
- 550 Crossing Ln
- 3091 Simpson Ct
- 3057 Wellington Ln Unit 8264
- Yeats Plan at Chamberlin Crossing
- Turnbull Plan at Chamberlin Crossing
- 3052 Simpson Ct
- 3052 Simpson Ct Unit 8337
- 3091 Simpson Ct Unit 8355
- 488 Crossing Ln
- Remington Plan at Chamberlin Crossing
- 460 Crossing Ln
- Salinger Plan at Chamberlin Crossing
- Sinclair Plan at Chamberlin Crossing
- 474 Crossing Ln
- 3067 Simpson Ct Unit 8349
- 3084 Simpson Ct Unit 8330
- Steinbeck Plan at Chamberlin Crossing
- 3032 Wellington Ln
- 2581 Delavan Dr
- 2621 Delavan Dr
- 2561 Delavan Dr
- 2641 Delavan Dr
- 2600 Bellsburg Dr
- 2580 Bellsburg Dr
- 2620 Bellsburg Dr
- 2560 Bellsburg Dr
- 2640 Bellsburg Dr
- 2541 Delavan Dr
- 2600 Delavan Dr
- 2620 Delavan Dr
- 2661 Delavan Dr
- 2580 Delavan Dr
- 2640 Delavan Dr
- 7420 Crossview Dr
- 2540 Bellsburg Dr
- 2650 Delavan Dr
- 2521 Delavan Dr
- 7400 Crossview Dr