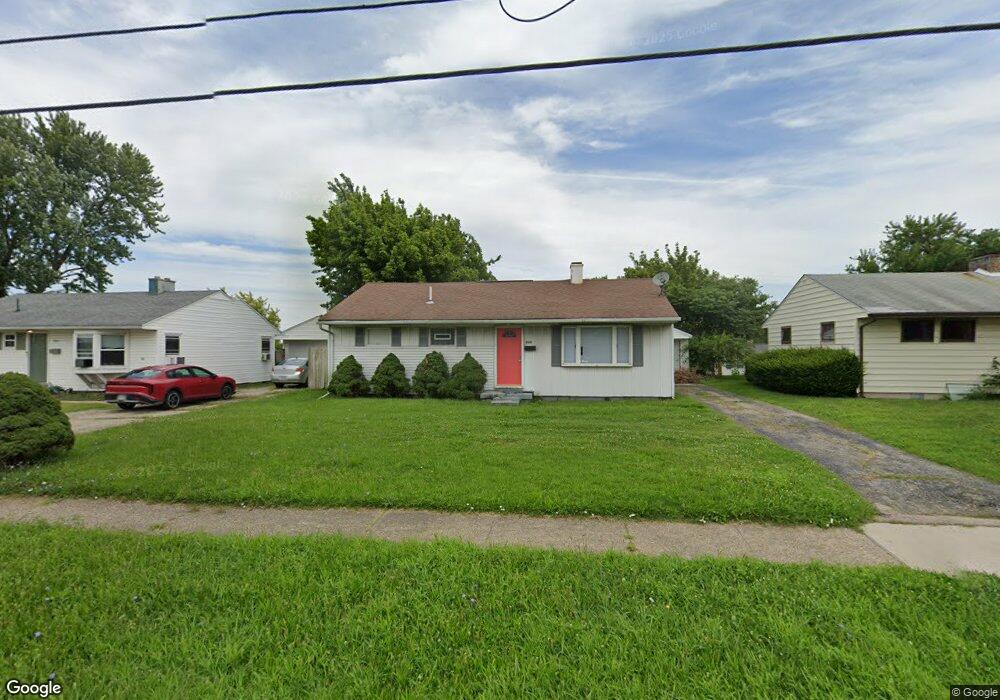
2601 E Dorothy Ln Dayton, OH 45420
Estimated Value: $152,000 - $198,000
3
Beds
1
Bath
960
Sq Ft
$182/Sq Ft
Est. Value
About This Home
This home is located at 2601 E Dorothy Ln, Dayton, OH 45420 and is currently estimated at $174,638, approximately $181 per square foot. 2601 E Dorothy Ln is a home located in Montgomery County with nearby schools including Indian Riffle Elementary School, Kettering Middle School, and Kettering Fairmont High School.
Ownership History
Date
Name
Owned For
Owner Type
Purchase Details
Closed on
Sep 17, 2021
Sold by
Turnkey Cashflow Llc
Bought by
Ayala Jose Manuel
Current Estimated Value
Home Financials for this Owner
Home Financials are based on the most recent Mortgage that was taken out on this home.
Original Mortgage
$100,000
Outstanding Balance
$90,395
Interest Rate
2.8%
Mortgage Type
New Conventional
Estimated Equity
$84,243
Purchase Details
Closed on
May 28, 2021
Sold by
Turnkey Cashflow Llc
Bought by
Jordan Logan and Jordan Jasmine
Purchase Details
Closed on
Sep 26, 2001
Sold by
Barrett Marcus W and Barrett Almeda F
Bought by
Larue David M and Larue Jennifer L
Home Financials for this Owner
Home Financials are based on the most recent Mortgage that was taken out on this home.
Original Mortgage
$70,001
Interest Rate
6.99%
Mortgage Type
FHA
Create a Home Valuation Report for This Property
The Home Valuation Report is an in-depth analysis detailing your home's value as well as a comparison with similar homes in the area
Home Values in the Area
Average Home Value in this Area
Purchase History
| Date | Buyer | Sale Price | Title Company |
|---|---|---|---|
| Ayala Jose Manuel | $136,000 | All Points Ttl & Closing Inc | |
| Jordan Logan | $97,000 | All Points Ttl & Closing Inc | |
| Turnkey Cashflow Llc | $74,700 | All Points Ttl & Closing Inc | |
| Larue David M | $71,100 | -- |
Source: Public Records
Mortgage History
| Date | Status | Borrower | Loan Amount |
|---|---|---|---|
| Open | Ayala Jose Manuel | $100,000 | |
| Previous Owner | Larue David M | $70,001 |
Source: Public Records
Tax History
| Year | Tax Paid | Tax Assessment Tax Assessment Total Assessment is a certain percentage of the fair market value that is determined by local assessors to be the total taxable value of land and additions on the property. | Land | Improvement |
|---|---|---|---|---|
| 2025 | $2,680 | $40,860 | $9,120 | $31,740 |
| 2024 | $2,606 | $40,860 | $9,120 | $31,740 |
| 2023 | $2,606 | $40,860 | $9,120 | $31,740 |
| 2022 | $2,191 | $27,120 | $6,040 | $21,080 |
| 2021 | $2,031 | $27,120 | $6,040 | $21,080 |
| 2020 | $2,267 | $27,120 | $6,040 | $21,080 |
| 2019 | $2,016 | $24,260 | $5,250 | $19,010 |
| 2018 | $2,027 | $24,260 | $5,250 | $19,010 |
| 2017 | $1,868 | $24,260 | $5,250 | $19,010 |
| 2016 | $1,767 | $21,540 | $5,250 | $16,290 |
| 2015 | $1,689 | $21,540 | $5,250 | $16,290 |
| 2014 | $1,689 | $21,540 | $5,250 | $16,290 |
| 2012 | -- | $24,950 | $7,000 | $17,950 |
Source: Public Records
Map
Nearby Homes
- 2971 Peony Place
- 3005 La Plata Dr
- 3009 La Plata Dr
- 2600 Ghent Ave
- 3313 Braddock St
- 3041 Revlon Dr
- 3167 Gracemore Ave
- 1851 Beaverton Dr
- 2703 Tihart Way
- 4201 Rushmore Place
- 2755 Rockledge Trail
- 1912 Echo Wood Ct
- 1820 Boesel Ave
- 3170 E Stroop Rd Unit 103
- 2167 W Bataan Dr
- 4387 Straight Arrow Rd Unit 4387
- 3700 Lisbon St
- 2197 Bending Willow Dr
- 4485 Sentry Hill Ct
- 4086 Glenheath Dr
- 2613 E Dorothy Ln
- 2525 E Dorothy Ln
- 2625 E Dorothy Ln
- 2521 E Dorothy Ln
- 2584 Danz Ave
- 2568 Danz Ave
- 2600 Danz Ave
- 2552 Danz Ave
- 2637 E Dorothy Ln
- 2517 E Dorothy Ln
- 2616 Danz Ave
- 2536 Danz Ave
- 2604 E Dorothy Ln
- 2632 Danz Ave
- 2528 E Dorothy Ln
- 2649 E Dorothy Ln
- 2513 E Dorothy Ln
- 2524 E Dorothy Ln
- 2520 Danz Ave
- 2520 E Dorothy Ln
Your Personal Tour Guide
Ask me questions while you tour the home.