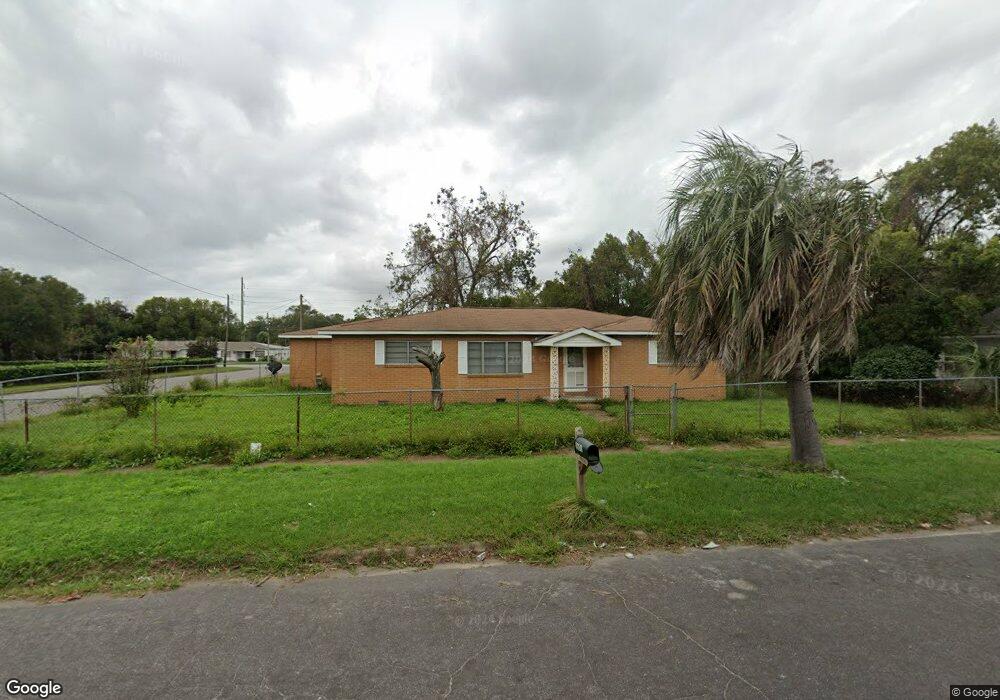
2601 Lee St Brunswick, GA 31520
Town Commons NeighborhoodEstimated Value: $164,000 - $206,000
3
Beds
2
Baths
1,892
Sq Ft
$94/Sq Ft
Est. Value
About This Home
This home is located at 2601 Lee St, Brunswick, GA 31520 and is currently estimated at $178,344, approximately $94 per square foot. 2601 Lee St is a home located in Glynn County with nearby schools including Burroughs-Molette Elementary School, Risley Middle School, and Brunswick High School.
Ownership History
Date
Name
Owned For
Owner Type
Purchase Details
Closed on
Aug 10, 2023
Sold by
Johnson Wilridge Candace Deborah
Bought by
Wilridge Samaria Fiona Johnson
Current Estimated Value
Purchase Details
Closed on
Dec 28, 2021
Sold by
Bryant Samaria Johnson
Bought by
Johnson Wilridge Candace Deborah
Purchase Details
Closed on
Jun 21, 2013
Sold by
Johnson Malessia
Bought by
Johnson Candace D
Purchase Details
Closed on
Aug 18, 2009
Sold by
Fannie Mae
Bought by
Johnson Malessia
Purchase Details
Closed on
Feb 3, 2009
Sold by
State Bank Fsb
Bought by
Federal National Mortgage Association
Purchase Details
Closed on
Jul 7, 2006
Sold by
Knight Charlie Mae
Bought by
Raymundo Rafael Z
Home Financials for this Owner
Home Financials are based on the most recent Mortgage that was taken out on this home.
Original Mortgage
$80,000
Interest Rate
6.54%
Mortgage Type
New Conventional
Create a Home Valuation Report for This Property
The Home Valuation Report is an in-depth analysis detailing your home's value as well as a comparison with similar homes in the area
Home Values in the Area
Average Home Value in this Area
Purchase History
| Date | Buyer | Sale Price | Title Company |
|---|---|---|---|
| Wilridge Samaria Fiona Johnson | -- | -- | |
| Johnson Wilridge Candace Deborah | -- | -- | |
| Bryant Samaria | -- | -- | |
| Johnson Wilridge Candace Deborah | -- | -- | |
| Bryant Samaria | -- | -- | |
| Johnson Candace D | -- | -- | |
| Johnson Malessia | $35,000 | -- | |
| Federal National Mortgage Association | $69,293 | -- | |
| State Farm Bank Fsb | $69,293 | -- | |
| Raymundo Rafael Z | $80,000 | -- |
Source: Public Records
Mortgage History
| Date | Status | Borrower | Loan Amount |
|---|---|---|---|
| Previous Owner | Raymundo Rafael Z | $80,000 |
Source: Public Records
Tax History Compared to Growth
Tax History
| Year | Tax Paid | Tax Assessment Tax Assessment Total Assessment is a certain percentage of the fair market value that is determined by local assessors to be the total taxable value of land and additions on the property. | Land | Improvement |
|---|---|---|---|---|
| 2025 | $1,338 | $63,640 | $6,560 | $57,080 |
| 2024 | $1,303 | $62,000 | $4,920 | $57,080 |
| 2023 | $1,922 | $46,040 | $4,920 | $41,120 |
| 2022 | $1,599 | $36,200 | $3,280 | $32,920 |
| 2021 | $1,144 | $23,520 | $3,280 | $20,240 |
| 2020 | $1,153 | $23,520 | $3,280 | $20,240 |
| 2019 | $522 | $23,520 | $3,280 | $20,240 |
| 2018 | $654 | $27,200 | $4,920 | $22,280 |
| 2017 | $1,271 | $27,200 | $4,920 | $22,280 |
| 2016 | $1,156 | $27,200 | $4,920 | $22,280 |
| 2015 | $1,179 | $27,200 | $4,920 | $22,280 |
| 2014 | $1,179 | $27,200 | $4,920 | $22,280 |
Source: Public Records
Map
Nearby Homes
- 2609 Lee St
- 2608 Stonewall St Unit 5
- 2612 Stonewall St
- 2617 Lee St
- 2600 Lee St
- 2614 Stonewall St
- 2621 Lee St
- 2622 Stonewall St
- 2605 Gordon St
- 2623 Lee St
- 2624 Stonewall St
- 2606 Altama Ave
- 2625 Lee St
- 2626 Stonewall St
- 2627 Lee St
- 2628 Stonewall St
- 2520 Martin Luther King jr Blvd
- 2514 Mlk jr Blvd
- 2520 Martin Luther King Blvd
- 2600 Gordon St