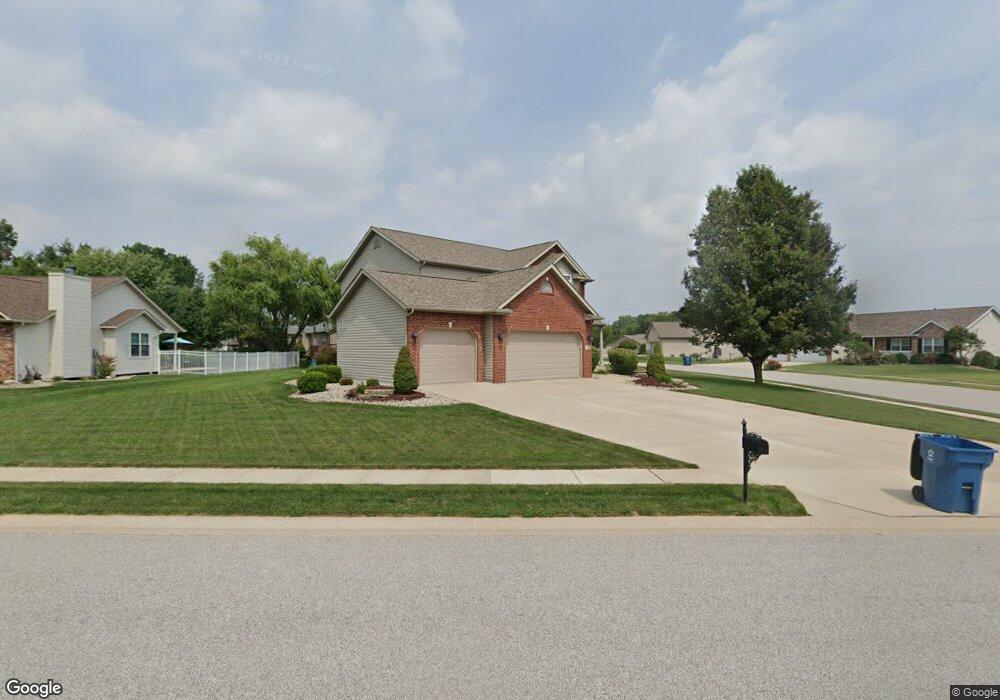
2601 Liberty Dr Maryville, IL 62062
Estimated Value: $379,962 - $402,000
3
Beds
4
Baths
1,176
Sq Ft
$332/Sq Ft
Est. Value
About This Home
This home is located at 2601 Liberty Dr, Maryville, IL 62062 and is currently estimated at $390,991, approximately $332 per square foot. 2601 Liberty Dr is a home located in Madison County with nearby schools including Maryville Elementary School, Dorris Intermediate School, and Collinsville Middle School.
Ownership History
Date
Name
Owned For
Owner Type
Purchase Details
Closed on
Sep 15, 2006
Sold by
H & L Builders Llc
Bought by
Muniz Joseph M and Muniz Natale S
Current Estimated Value
Home Financials for this Owner
Home Financials are based on the most recent Mortgage that was taken out on this home.
Original Mortgage
$190,150
Outstanding Balance
$113,694
Interest Rate
6.59%
Mortgage Type
Unknown
Estimated Equity
$277,297
Purchase Details
Closed on
Mar 30, 2006
Sold by
Jfm Land Development Llc
Bought by
H & L Builders Llc
Home Financials for this Owner
Home Financials are based on the most recent Mortgage that was taken out on this home.
Original Mortgage
$160,000
Interest Rate
7.3%
Mortgage Type
Construction
Purchase Details
Closed on
Jul 25, 2005
Sold by
Landreth Land Llc
Bought by
Jfm Land Development Llc
Create a Home Valuation Report for This Property
The Home Valuation Report is an in-depth analysis detailing your home's value as well as a comparison with similar homes in the area
Home Values in the Area
Average Home Value in this Area
Purchase History
| Date | Buyer | Sale Price | Title Company |
|---|---|---|---|
| Muniz Joseph M | $237,500 | Abstracts & Titles Inc | |
| H & L Builders Llc | $37,000 | Abstracts & Titles Inc | |
| Jfm Land Development Llc | -- | -- |
Source: Public Records
Mortgage History
| Date | Status | Borrower | Loan Amount |
|---|---|---|---|
| Open | Muniz Joseph M | $190,150 | |
| Previous Owner | H & L Builders Llc | $160,000 |
Source: Public Records
Tax History Compared to Growth
Tax History
| Year | Tax Paid | Tax Assessment Tax Assessment Total Assessment is a certain percentage of the fair market value that is determined by local assessors to be the total taxable value of land and additions on the property. | Land | Improvement |
|---|---|---|---|---|
| 2024 | $7,165 | $112,920 | $21,660 | $91,260 |
| 2023 | $7,165 | $104,520 | $20,050 | $84,470 |
| 2022 | $6,769 | $96,650 | $18,540 | $78,110 |
| 2021 | $6,105 | $90,800 | $17,420 | $73,380 |
| 2020 | $5,509 | $81,570 | $15,640 | $65,930 |
| 2019 | $5,348 | $78,790 | $15,110 | $63,680 |
| 2018 | $5,212 | $74,640 | $14,310 | $60,330 |
| 2017 | $5,191 | $73,160 | $14,030 | $59,130 |
| 2016 | $5,440 | $73,160 | $14,030 | $59,130 |
| 2015 | $5,062 | $71,260 | $13,670 | $57,590 |
| 2014 | $5,062 | $71,260 | $13,670 | $57,590 |
| 2013 | $5,062 | $71,260 | $13,670 | $57,590 |
Source: Public Records
Map
Nearby Homes
- 104 Summit Ridge Unit 104
- 2723 Keebler Rd
- 6020 Keebler Oaks Dr
- 2704 Stone Valley Dr
- 22 Oak Valley Dr
- 54 Oak Leaf Dr
- 2790 Deerfield Dr
- 2708 Fieldstone Dr
- 912 Oakridge Dr
- 1029 Andra Dr
- 5 Deer Trail Dr
- 1014 Daniel Dr
- 1005 Daniel Dr
- 58 Stonebridge Crossing Dr
- 54 Stonebridge Crossing Dr
- 50 Stonebridge Crossing Dr
- 113 Stonebridge Crossing Dr
- 6 Doe Run Trail
- 2923 Kehrswood Ct
- 625 W Country Ln