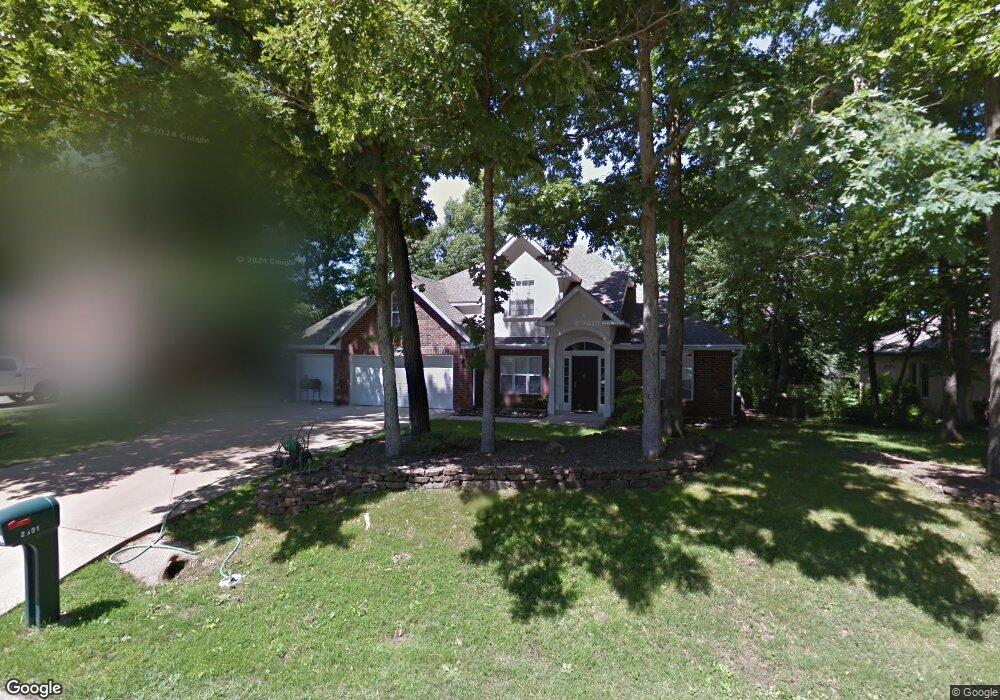
2601 Linebarger Ln Bentonville, AR 72712
Estimated Value: $641,000 - $694,000
--
Bed
3
Baths
2,658
Sq Ft
$253/Sq Ft
Est. Value
About This Home
This home is located at 2601 Linebarger Ln, Bentonville, AR 72712 and is currently estimated at $672,565, approximately $253 per square foot. 2601 Linebarger Ln is a home located in Benton County with nearby schools including Sugar Creek Elementary School, Lincoln Junior High School, and Old High Middle School.
Ownership History
Date
Name
Owned For
Owner Type
Purchase Details
Closed on
May 17, 2013
Sold by
Mahan Lee Darby and Mahan Darcie D
Bought by
Simmermon Randall S and Simmermon Angela G
Current Estimated Value
Home Financials for this Owner
Home Financials are based on the most recent Mortgage that was taken out on this home.
Original Mortgage
$175,000
Outstanding Balance
$123,727
Interest Rate
3.43%
Estimated Equity
$548,838
Purchase Details
Closed on
May 4, 2001
Bought by
Mahan
Purchase Details
Closed on
Aug 2, 2000
Bought by
Dagley
Purchase Details
Closed on
Nov 30, 1998
Bought by
Virta
Purchase Details
Closed on
Jun 13, 1994
Bought by
Hidden Spr Ent
Purchase Details
Closed on
May 3, 1994
Bought by
N and A
Purchase Details
Closed on
May 22, 1990
Bought by
Saba and Saba Elqura
Create a Home Valuation Report for This Property
The Home Valuation Report is an in-depth analysis detailing your home's value as well as a comparison with similar homes in the area
Home Values in the Area
Average Home Value in this Area
Purchase History
| Date | Buyer | Sale Price | Title Company |
|---|---|---|---|
| Simmermon Randall S | $230,000 | First National Title Company | |
| Mahan | $218,000 | -- | |
| Dagley | $32,000 | -- | |
| Virta | $27,000 | -- | |
| Hidden Spr Ent | -- | -- | |
| N | -- | -- | |
| Saba | -- | -- |
Source: Public Records
Mortgage History
| Date | Status | Borrower | Loan Amount |
|---|---|---|---|
| Open | Simmermon Randall S | $175,000 |
Source: Public Records
Tax History Compared to Growth
Tax History
| Year | Tax Paid | Tax Assessment Tax Assessment Total Assessment is a certain percentage of the fair market value that is determined by local assessors to be the total taxable value of land and additions on the property. | Land | Improvement |
|---|---|---|---|---|
| 2025 | $4,124 | $106,383 | $30,000 | $76,383 |
| 2024 | $3,954 | $106,383 | $30,000 | $76,383 |
| 2023 | $3,765 | $66,150 | $8,600 | $57,550 |
| 2022 | $3,314 | $66,150 | $8,600 | $57,550 |
| 2021 | $3,135 | $66,150 | $8,600 | $57,550 |
| 2020 | $3,000 | $52,980 | $7,400 | $45,580 |
| 2019 | $3,000 | $52,980 | $7,400 | $45,580 |
| 2018 | $3,025 | $52,980 | $7,400 | $45,580 |
| 2017 | $2,919 | $52,980 | $7,400 | $45,580 |
| 2016 | $2,919 | $52,980 | $7,400 | $45,580 |
| 2015 | $3,159 | $51,110 | $8,000 | $43,110 |
| 2014 | $2,809 | $51,110 | $8,000 | $43,110 |
Source: Public Records
Map
Nearby Homes
- 0 NW Turner Dr
- 2311 NW Harvard Walk
- 2017 NW Desoto Dr
- 9 Hanna Dr
- Lot 3 NW Hidden Cove
- 3119 N Walton Blvd
- 802 NW 20th St
- 203 NW Lasalle Dr
- 12502 Slaughter Pen Rd
- 1801 Kimberly Place
- 49 Stonehenge Dr
- 1703 Kimberly Place
- 1605 Kimberly Place
- 1 Greenridge Ln
- 3419 NW Riverbend Rd
- 5 NW Robson Way
- 1022 NW A St
- 1016 NW A St
- 809 NE Heights Ln
- 811 NE Heights Ln
- 2601 NW Linebarger Ln
- 2603 NW Linebarger Ln
- 2511 NW Linebarger Ln
- 2511 NW Linebarger Ln
- 2509 Linebarger Ln
- 2605 Linebarger Ln
- 2605 NW Linebarger Ln
- 2602 NW Linebarger Ln
- 2510 NW Linebarger Ln
- 2510 NW Linebarger Ln
- 2507 Linebarger Ln
- 2508 NW Linebarger Ln
- 2600 Linebarger Ln
- 2506 NW Linebarger Ln
- 2506 NW Linebarger Ln
- 2505 NW Linebarger Ln
- 2505 NW Linebarger Ln
- 2508 Linebarger Ln
- 2606 Linebarger Ln
- 2606 NW Linebarger Ln