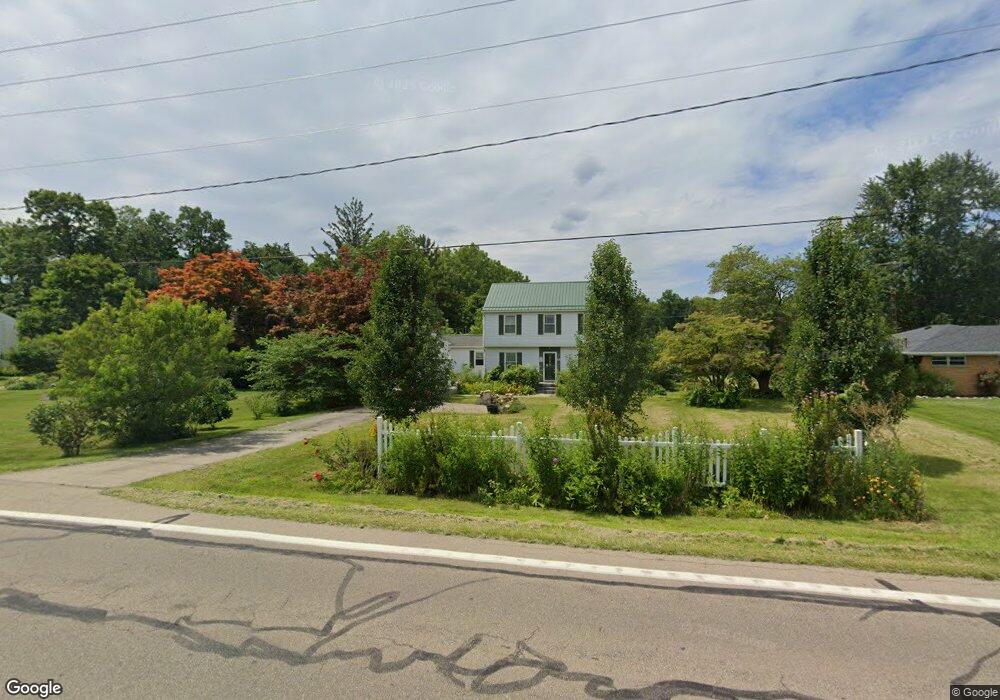
2601 Mechanicsburg Rd Springfield, OH 45503
Estimated Value: $207,000 - $243,000
3
Beds
2
Baths
1,670
Sq Ft
$135/Sq Ft
Est. Value
About This Home
This home is located at 2601 Mechanicsburg Rd, Springfield, OH 45503 and is currently estimated at $225,134, approximately $134 per square foot. 2601 Mechanicsburg Rd is a home located in Clark County with nearby schools including Rolling Hills Elementary School, Northridge Middle School, and Kenton Ridge Middle & High School.
Ownership History
Date
Name
Owned For
Owner Type
Purchase Details
Closed on
Oct 13, 2016
Sold by
Maxwell Bertha I and Maxwell Philip Lynn
Bought by
Lang Elisabeth and Lang Anthony H
Current Estimated Value
Home Financials for this Owner
Home Financials are based on the most recent Mortgage that was taken out on this home.
Original Mortgage
$125,400
Outstanding Balance
$100,532
Interest Rate
3.46%
Mortgage Type
New Conventional
Estimated Equity
$124,602
Purchase Details
Closed on
Oct 9, 2008
Sold by
Pooler Lawrence L and Pooler Cheryl L
Bought by
Chenoweth Bertha I
Home Financials for this Owner
Home Financials are based on the most recent Mortgage that was taken out on this home.
Original Mortgage
$87,000
Interest Rate
6.43%
Mortgage Type
Purchase Money Mortgage
Purchase Details
Closed on
Oct 20, 1993
Sold by
Trisel Robin J and Trisel Cindi L
Bought by
Pooler Lawrence L and Pooler Cheryl L
Purchase Details
Closed on
Jul 2, 1993
Create a Home Valuation Report for This Property
The Home Valuation Report is an in-depth analysis detailing your home's value as well as a comparison with similar homes in the area
Home Values in the Area
Average Home Value in this Area
Purchase History
| Date | Buyer | Sale Price | Title Company |
|---|---|---|---|
| Lang Elisabeth | $131,000 | Ohio Real Estate Title | |
| Chenoweth Bertha I | $127,000 | Rels Title | |
| Pooler Lawrence L | -- | -- | |
| -- | $76,000 | -- |
Source: Public Records
Mortgage History
| Date | Status | Borrower | Loan Amount |
|---|---|---|---|
| Open | Lang Elisabeth | $125,400 | |
| Previous Owner | Chenoweth Bertha I | $87,000 |
Source: Public Records
Tax History Compared to Growth
Tax History
| Year | Tax Paid | Tax Assessment Tax Assessment Total Assessment is a certain percentage of the fair market value that is determined by local assessors to be the total taxable value of land and additions on the property. | Land | Improvement |
|---|---|---|---|---|
| 2024 | $2,270 | $53,690 | $13,770 | $39,920 |
| 2023 | $2,270 | $53,690 | $13,770 | $39,920 |
| 2022 | $2,279 | $53,690 | $13,770 | $39,920 |
| 2021 | $2,203 | $44,000 | $11,280 | $32,720 |
| 2020 | $2,205 | $44,000 | $11,280 | $32,720 |
| 2019 | $2,247 | $44,000 | $11,280 | $32,720 |
| 2018 | $1,978 | $37,160 | $10,450 | $26,710 |
| 2017 | $1,695 | $37,160 | $10,448 | $26,712 |
| 2016 | $1,683 | $37,160 | $10,448 | $26,712 |
| 2015 | $1,632 | $34,703 | $10,448 | $24,255 |
| 2014 | $1,632 | $34,703 | $10,448 | $24,255 |
| 2013 | $1,594 | $34,703 | $10,448 | $24,255 |
Source: Public Records
Map
Nearby Homes
- 2805 Old Oak Ln
- 2340 E Home Rd
- 2939 Mechanicsburg Rd
- 3316 Sudbury St
- 3231 Vineyard St
- 3214 Revels St
- 1939 Providence Ave
- 1811 Devon Dr
- 2022 Westboro Ave
- 3307 Tackett St
- 2419 Gladden St
- 1920 Wedgewood Cir
- 1922 Wedgewood Cir
- 2907 Mystic Ln
- 2124 Tavenner Ave
- 3129 Haverhill St
- 2655 Merritt St
- 1732 Falmouth Ave
- The Siebert Plan at Magnolia Acres
- 1506 Hyannis Dr
- 2565 Mechanicsburg Rd
- 2611 Mechanicsburg Rd
- 2625 Mechanicsburg Rd
- 2625 Mechanicsburg Rd
- 2555 Mechanicsburg Rd
- 2545 Mechanicsburg Rd
- 2535 Mechanicsburg Rd
- 2155 Conowoods Dr
- 2163 Conowoods Dr
- 2147 Conowoods Dr
- 2560 Middle Urbana Rd
- 2564 Middle Urbana Rd
- 2139 Conowoods Dr
- 2167 Conowoods Dr
- 2137 Conowoods Dr
- 2133 Conowoods Dr
- 2710 Conowoods Dr
- 2146 Conowoods Dr
- 2594 Middle Urbana Rd
- 2702 Edna Ln