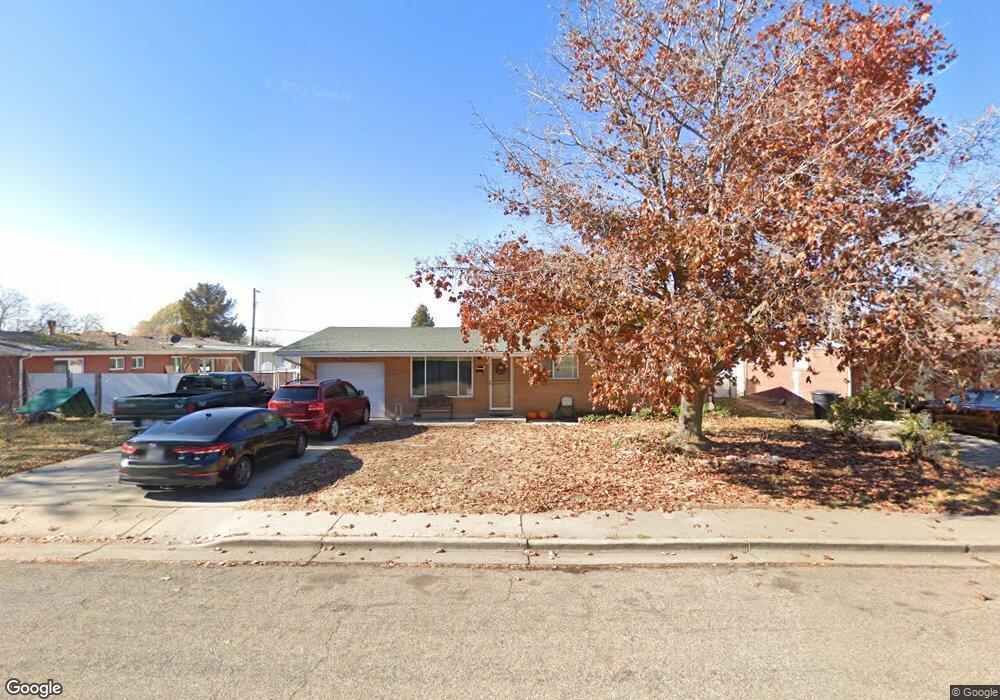
2601 N 225 W Clearfield, UT 84015
Estimated Value: $347,000 - $390,000
3
Beds
1
Bath
1,146
Sq Ft
$316/Sq Ft
Est. Value
About This Home
This home is located at 2601 N 225 W, Clearfield, UT 84015 and is currently estimated at $362,478, approximately $316 per square foot. 2601 N 225 W is a home located in Davis County with nearby schools including Fremont School, Sunset Junior High School, and Northridge High School.
Ownership History
Date
Name
Owned For
Owner Type
Purchase Details
Closed on
May 23, 2018
Sold by
Bellucci Theresa Jo
Bought by
2601 Sunset Llc
Current Estimated Value
Purchase Details
Closed on
Jan 28, 1997
Sold by
Richards Jason and Richards Gina
Bought by
Bellucci Theresa Jo
Home Financials for this Owner
Home Financials are based on the most recent Mortgage that was taken out on this home.
Original Mortgage
$79,857
Interest Rate
7.74%
Mortgage Type
FHA
Create a Home Valuation Report for This Property
The Home Valuation Report is an in-depth analysis detailing your home's value as well as a comparison with similar homes in the area
Home Values in the Area
Average Home Value in this Area
Purchase History
| Date | Buyer | Sale Price | Title Company |
|---|---|---|---|
| 2601 Sunset Llc | -- | Sutherland Title | |
| Bellucci Theresa Jo | -- | Avis & Archibald Title Insur |
Source: Public Records
Mortgage History
| Date | Status | Borrower | Loan Amount |
|---|---|---|---|
| Previous Owner | Bellucci Theresa Jo | $79,857 |
Source: Public Records
Tax History Compared to Growth
Tax History
| Year | Tax Paid | Tax Assessment Tax Assessment Total Assessment is a certain percentage of the fair market value that is determined by local assessors to be the total taxable value of land and additions on the property. | Land | Improvement |
|---|---|---|---|---|
| 2025 | $1,869 | $170,500 | $77,961 | $92,539 |
| 2024 | $1,706 | $155,649 | $74,491 | $81,158 |
| 2023 | $1,599 | $146,300 | $65,244 | $81,055 |
| 2022 | $1,692 | $277,000 | $122,702 | $154,298 |
| 2021 | $1,470 | $208,000 | $74,606 | $133,394 |
| 2020 | $1,286 | $179,000 | $63,306 | $115,694 |
| 2019 | $1,212 | $173,000 | $77,302 | $95,698 |
| 2018 | $1,074 | $150,000 | $61,776 | $88,224 |
| 2016 | $880 | $63,140 | $29,224 | $33,916 |
| 2015 | $926 | $62,975 | $29,259 | $33,716 |
| 2014 | $767 | $53,345 | $29,259 | $24,086 |
| 2013 | -- | $61,146 | $23,265 | $37,881 |
Source: Public Records
Map
Nearby Homes