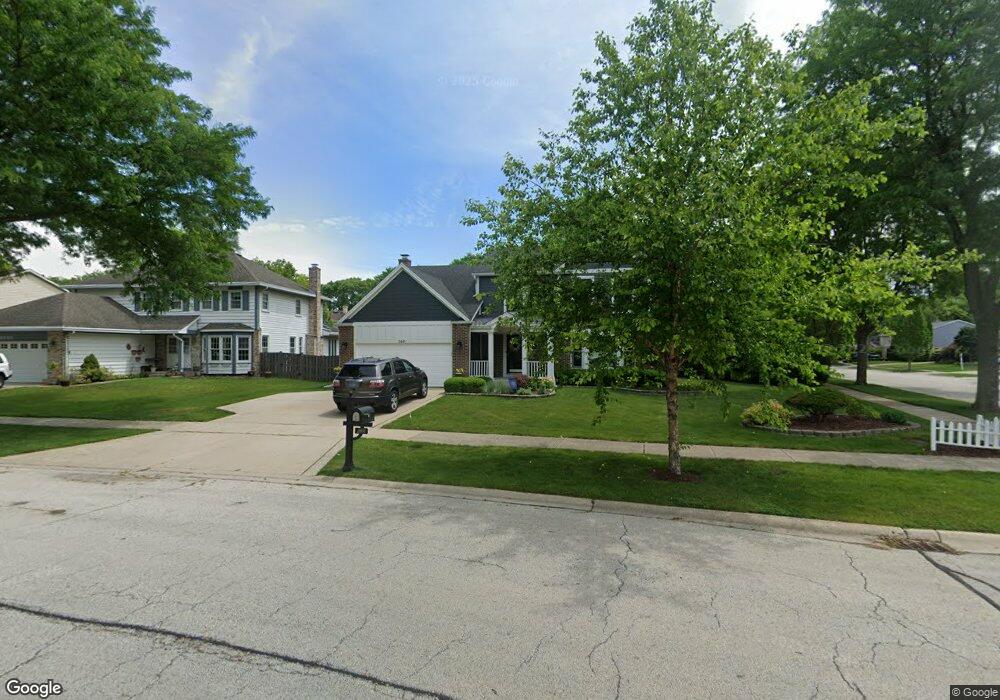
2601 N Wilshire Ln Arlington Heights, IL 60004
Estimated Value: $614,503 - $651,000
4
Beds
3
Baths
2,007
Sq Ft
$314/Sq Ft
Est. Value
About This Home
This home is located at 2601 N Wilshire Ln, Arlington Heights, IL 60004 and is currently estimated at $630,501, approximately $314 per square foot. 2601 N Wilshire Ln is a home located in Cook County with nearby schools including Dwight D Eisenhower Elementary School, Anne Sullivan Elementary School, and Betsy Ross Elementary School.
Ownership History
Date
Name
Owned For
Owner Type
Purchase Details
Closed on
Jan 19, 2019
Sold by
Pearson Michael A
Bought by
Pearson Michael A and Michael A Pearson Revocable Trust
Current Estimated Value
Purchase Details
Closed on
Apr 17, 2003
Sold by
Mccollum Harry T and Mccollum Ann Catherine
Bought by
Pearson Michael
Home Financials for this Owner
Home Financials are based on the most recent Mortgage that was taken out on this home.
Original Mortgage
$322,700
Outstanding Balance
$141,375
Interest Rate
6.02%
Mortgage Type
Unknown
Estimated Equity
$489,126
Purchase Details
Closed on
Dec 1, 1994
Sold by
Pictor Thomas and Pictor Mary Ellen
Bought by
Mccollum Harry T and Mccollum Ann Catherine
Home Financials for this Owner
Home Financials are based on the most recent Mortgage that was taken out on this home.
Original Mortgage
$203,150
Interest Rate
7.75%
Create a Home Valuation Report for This Property
The Home Valuation Report is an in-depth analysis detailing your home's value as well as a comparison with similar homes in the area
Home Values in the Area
Average Home Value in this Area
Purchase History
| Date | Buyer | Sale Price | Title Company |
|---|---|---|---|
| Pearson Michael A | -- | Attorney | |
| Pearson Michael | $430,000 | Pntn | |
| Pearson Michael | $430,000 | Pntn | |
| Mccollum Harry T | $268,000 | Attorneys Title Guaranty Fun |
Source: Public Records
Mortgage History
| Date | Status | Borrower | Loan Amount |
|---|---|---|---|
| Open | Pearson Michael | $322,700 | |
| Closed | Pearson Michael | $322,700 | |
| Previous Owner | Mccollum Harry T | $203,150 | |
| Closed | Pearson Michael | $64,250 |
Source: Public Records
Tax History Compared to Growth
Tax History
| Year | Tax Paid | Tax Assessment Tax Assessment Total Assessment is a certain percentage of the fair market value that is determined by local assessors to be the total taxable value of land and additions on the property. | Land | Improvement |
|---|---|---|---|---|
| 2024 | $10,027 | $40,000 | $11,271 | $28,729 |
| 2023 | $9,547 | $40,000 | $11,271 | $28,729 |
| 2022 | $9,547 | $40,000 | $11,271 | $28,729 |
| 2021 | $9,467 | $34,476 | $6,403 | $28,073 |
| 2020 | $9,283 | $34,476 | $6,403 | $28,073 |
| 2019 | $9,258 | $38,435 | $6,403 | $32,032 |
| 2018 | $9,377 | $35,640 | $5,635 | $30,005 |
| 2017 | $9,296 | $35,640 | $5,635 | $30,005 |
| 2016 | $8,896 | $35,640 | $5,635 | $30,005 |
| 2015 | $8,725 | $31,981 | $4,866 | $27,115 |
| 2014 | $8,627 | $31,981 | $4,866 | $27,115 |
| 2013 | $8,415 | $31,981 | $4,866 | $27,115 |
Source: Public Records
Map
Nearby Homes
- 2608 N Wilshire Ln
- 2624 N Prindle Ave
- 2616 N Prindle Ave
- 1925 E Waverly Ln
- 2632 N Windsor Dr Unit 104
- 2604 N Windsor Dr Unit 206
- 2640 N Windsor Dr Unit 102
- 2620 N Windsor Dr Unit 201
- 2143 E Peachtree Ln
- 1038 Harbour Ct Unit 2A
- 1054 Harbour Ct Unit 1A
- 1500 Harbour Dr Unit 1D
- 1500 Harbour Dr Unit 2K
- 1424 E Jonquil Cir
- 791 Lakeside Circle Dr Unit 1
- 1044 Creekside Ct Unit 2B
- 705 Lakeside Circle Dr Unit 2
- 671 Cedarwood Ct Unit 2
- 691 Lakeside Circle Dr
- 1306 E Best Dr
- 2605 N Wilshire Ln
- 2602 N Stratford Rd
- 2609 N Wilshire Ln
- 2610 N Stratford Rd
- 1607 E Suffield Dr
- 1611 E Suffield Dr
- 1603 E Suffield Dr
- 2611 N Wilshire Ln
- 1619 E Suffield Dr
- 2614 N Stratford Rd
- 1523 E Suffield Dr
- 1703 E Suffield Dr
- 1517 E Suffield Dr
- 2618 N Stratford Rd
- 2617 N Wilshire Ln
- 1608 E Waverly Dr
- 1612 E Waverly Dr
- 2603 N Stratford Rd
- 2607 N Stratford Rd
- 2612 N Wilshire Ln