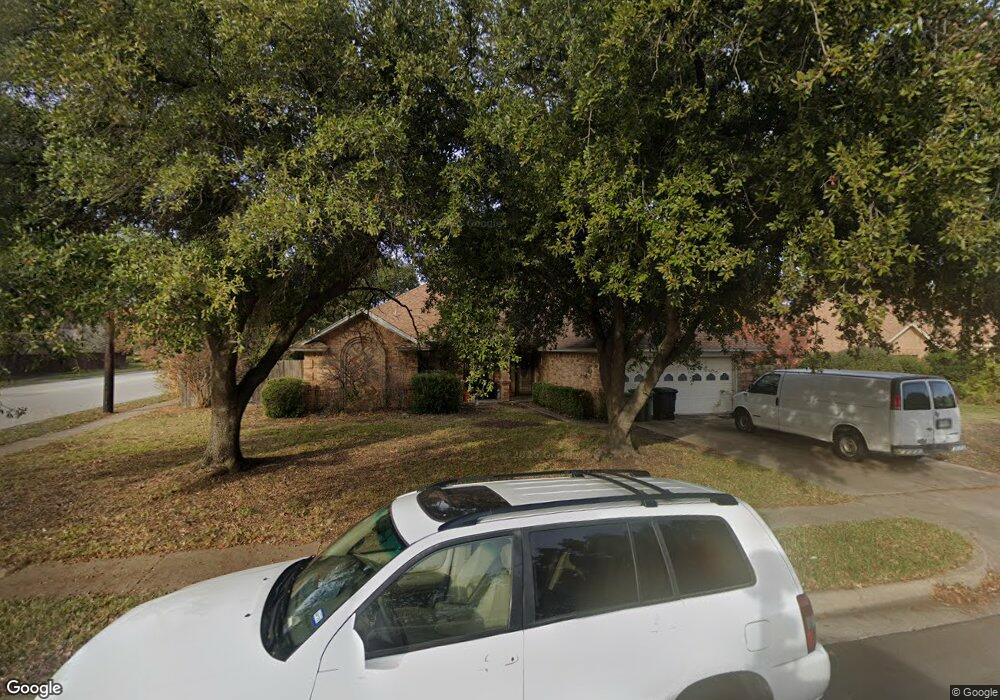
2601 New Bedford Ct Bedford, TX 76022
Estimated Value: $346,000 - $384,515
3
Beds
2
Baths
1,821
Sq Ft
$199/Sq Ft
Est. Value
About This Home
This home is located at 2601 New Bedford Ct, Bedford, TX 76022 and is currently estimated at $362,879, approximately $199 per square foot. 2601 New Bedford Ct is a home located in Tarrant County with nearby schools including Wilshire Elementary School, Harwood Junior High School, and Trinity High School.
Ownership History
Date
Name
Owned For
Owner Type
Purchase Details
Closed on
Dec 13, 2016
Sold by
Ross Craig C and Ross Janice E
Bought by
Peters Valerie Indigo
Current Estimated Value
Home Financials for this Owner
Home Financials are based on the most recent Mortgage that was taken out on this home.
Original Mortgage
$184,500
Outstanding Balance
$148,750
Interest Rate
3.47%
Mortgage Type
New Conventional
Estimated Equity
$214,129
Purchase Details
Closed on
Jul 8, 2008
Sold by
Ahmed Mirza F and Ahmed Sophia Anna
Bought by
Ross Craig C and Ross Janice E
Home Financials for this Owner
Home Financials are based on the most recent Mortgage that was taken out on this home.
Original Mortgage
$160,087
Interest Rate
6.36%
Mortgage Type
Purchase Money Mortgage
Create a Home Valuation Report for This Property
The Home Valuation Report is an in-depth analysis detailing your home's value as well as a comparison with similar homes in the area
Home Values in the Area
Average Home Value in this Area
Purchase History
| Date | Buyer | Sale Price | Title Company |
|---|---|---|---|
| Peters Valerie Indigo | -- | Wfg National Title | |
| Ross Craig C | -- | Fnt |
Source: Public Records
Mortgage History
| Date | Status | Borrower | Loan Amount |
|---|---|---|---|
| Open | Peters Valerie Indigo | $184,500 | |
| Previous Owner | Ross Craig C | $160,087 |
Source: Public Records
Tax History Compared to Growth
Tax History
| Year | Tax Paid | Tax Assessment Tax Assessment Total Assessment is a certain percentage of the fair market value that is determined by local assessors to be the total taxable value of land and additions on the property. | Land | Improvement |
|---|---|---|---|---|
| 2025 | $5,198 | $349,607 | $75,000 | $274,607 |
| 2024 | $5,198 | $349,607 | $75,000 | $274,607 |
| 2023 | $5,792 | $348,106 | $45,000 | $303,106 |
| 2022 | $5,996 | $289,627 | $45,000 | $244,627 |
| 2021 | $5,879 | $249,566 | $45,000 | $204,566 |
| 2020 | $5,973 | $251,203 | $45,000 | $206,203 |
| 2019 | $5,690 | $252,839 | $45,000 | $207,839 |
| 2018 | $4,791 | $212,926 | $22,000 | $190,926 |
| 2017 | $4,754 | $196,496 | $22,000 | $174,496 |
| 2016 | $4,090 | $173,000 | $22,000 | $151,000 |
| 2015 | $3,585 | $153,700 | $22,000 | $131,700 |
| 2014 | $3,585 | $153,700 | $22,000 | $131,700 |
Source: Public Records
Map
Nearby Homes
- 2620 Britany Cir
- 2420 Dalewood Ln
- 2504 Westpark Way Cir
- 2303 Mcmullin Dr
- 2428 Chestnut Way
- 800 Prestwick St
- 828 Gregory Ave
- 808 Gregory Ave
- 1049 Stableway Ln
- 1116 Highpoint Rd
- 2150 Eva Ln
- 2101 Gettysburg Place
- 2024 Charleston Dr
- 1216 Princeton Place
- 1213 Greendale Dr
- 2421 Creek Villas Dr
- 2201 Greendale Ct
- 2025 Schumac Ln
- 1911 Long Bow Trail
- 804 Natchez Ave
- 2605 New Bedford Ct
- 2600 Plymouth Ct
- 2517 New Haven Ct
- 2604 Plymouth Ct
- 2600 New Bedford Ct
- 2609 New Bedford Ct
- 2516 Rochester Ct
- 2608 Plymouth Ct
- 2604 New Bedford Ct
- 2513 New Haven Ct
- 2516 New Haven Ct
- 2512 Rochester Ct
- 2608 New Bedford Ct
- 2617 New Bedford Ct
- 2509 New Haven Ct
- 2601 Plymouth Ct
- 2512 New Haven Ct
- 2621 New Bedford Ct
- 2680 Britany Cir
- 2508 Rochester Ct