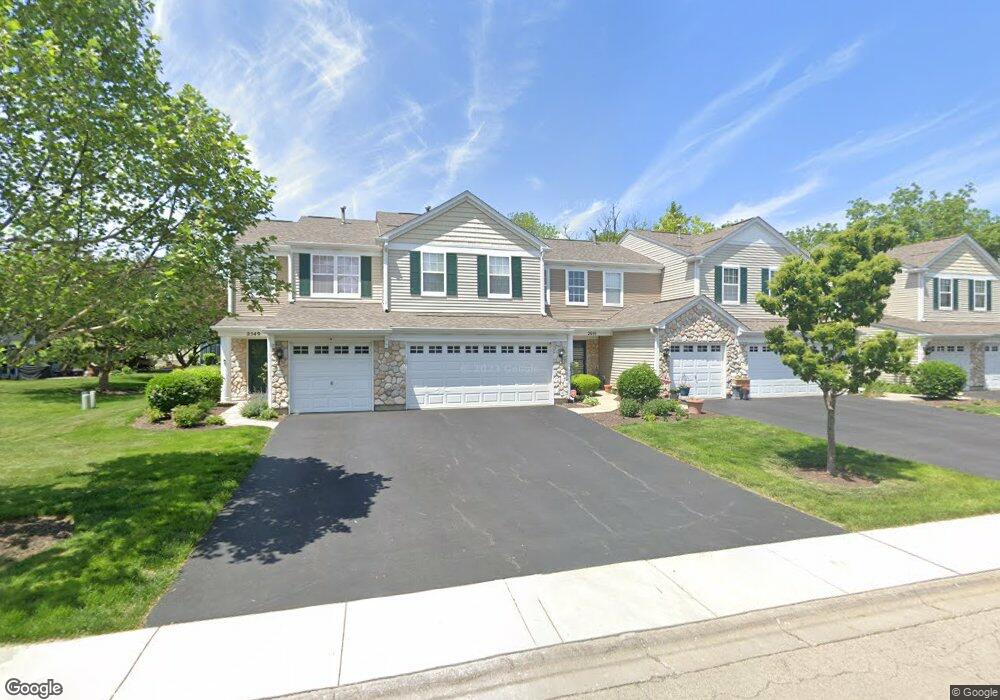
2601 Oak Tree Ln Plainfield, IL 60586
East Plainfield NeighborhoodEstimated Value: $241,000 - $243,000
2
Beds
3
Baths
1,049
Sq Ft
$231/Sq Ft
Est. Value
About This Home
This home is located at 2601 Oak Tree Ln, Plainfield, IL 60586 and is currently estimated at $242,000, approximately $230 per square foot. 2601 Oak Tree Ln is a home located in Will County with nearby schools including River View Elementary School, Timber Ridge Middle School, and Plainfield Central High School.
Ownership History
Date
Name
Owned For
Owner Type
Purchase Details
Closed on
Aug 19, 2005
Sold by
Ellison Richard L and Ellison Jennifer
Bought by
Cavada Jesus M and Cavada Laura A
Current Estimated Value
Home Financials for this Owner
Home Financials are based on the most recent Mortgage that was taken out on this home.
Original Mortgage
$118,400
Outstanding Balance
$63,114
Interest Rate
5.89%
Mortgage Type
Fannie Mae Freddie Mac
Estimated Equity
$178,886
Purchase Details
Closed on
Jul 31, 2002
Sold by
Grachen Elma Linda and Diaz Elma Linda
Bought by
Ellison Richard L and Ellison Jennifer
Home Financials for this Owner
Home Financials are based on the most recent Mortgage that was taken out on this home.
Original Mortgage
$108,500
Interest Rate
5.25%
Purchase Details
Closed on
Aug 8, 2000
Sold by
Centex Homes
Bought by
Diaz Elma Linda
Home Financials for this Owner
Home Financials are based on the most recent Mortgage that was taken out on this home.
Original Mortgage
$106,340
Interest Rate
8.26%
Mortgage Type
FHA
Create a Home Valuation Report for This Property
The Home Valuation Report is an in-depth analysis detailing your home's value as well as a comparison with similar homes in the area
Home Values in the Area
Average Home Value in this Area
Purchase History
| Date | Buyer | Sale Price | Title Company |
|---|---|---|---|
| Cavada Jesus M | $148,000 | First American Title Insuran | |
| Ellison Richard L | $115,000 | Ticor Title | |
| Diaz Elma Linda | $107,000 | Chicago Title Insurance Co |
Source: Public Records
Mortgage History
| Date | Status | Borrower | Loan Amount |
|---|---|---|---|
| Open | Cavada Jesus M | $118,400 | |
| Previous Owner | Ellison Richard L | $108,500 | |
| Previous Owner | Diaz Elma Linda | $106,340 |
Source: Public Records
Tax History
| Year | Tax Paid | Tax Assessment Tax Assessment Total Assessment is a certain percentage of the fair market value that is determined by local assessors to be the total taxable value of land and additions on the property. | Land | Improvement |
|---|---|---|---|---|
| 2024 | $4,493 | $62,730 | $13,476 | $49,254 |
| 2023 | $4,493 | $56,656 | $12,171 | $44,485 |
| 2022 | $3,924 | $49,976 | $10,736 | $39,240 |
| 2021 | $3,738 | $46,707 | $10,034 | $36,673 |
| 2020 | $3,689 | $45,382 | $9,749 | $35,633 |
| 2019 | $3,574 | $43,241 | $9,289 | $33,952 |
| 2018 | $3,437 | $40,627 | $8,727 | $31,900 |
| 2017 | $3,110 | $35,852 | $8,293 | $27,559 |
| 2016 | $3,059 | $34,193 | $7,909 | $26,284 |
| 2015 | $2,882 | $32,031 | $7,409 | $24,622 |
| 2014 | $2,882 | $30,900 | $7,147 | $23,753 |
| 2013 | $2,882 | $30,900 | $7,147 | $23,753 |
Source: Public Records
Map
Nearby Homes
- 4013 Oak Tree Ln
- 2350 Woodhill Ct
- 2331 Woodhill Ct
- 2512 Lockner Blvd
- 2218 Dalewood Ct
- 2173 Dalewood Ct Unit 3
- 3020 Abbey Cir
- 3005 Abbey Cir
- 3040 Abbey Cir
- 3812 Hennepin Dr
- 23058 Arbor Creek Dr
- 3507 Lake Shore Dr
- 2929 Woodside Dr Unit 26
- 4022 Hennepin Dr Unit 171
- 2949 Woodside Dr Unit 133
- 3100 Jo Ann Dr
- 2914 Woodside Dr Unit 109
- 3105 Woodside Dr Unit 162
- 3716 Fiday Rd
- 2714 Lake Side Cir
- 2603 Oak Tree Ln
- 2551 Oak Tree Ln Unit 2
- 2605 Oak Tree Ln
- 2549 Oak Tree Ln
- 2607 Oak Tree Ln
- 2611 Oak Tree Ln
- 4137 Oak Tree Ln Unit 2
- 4139 Oak Tree Ln
- 2613 Oak Tree Ln Unit 2
- 2613 Oak Tree Ln Unit 3
- 4143 Oak Tree Ln
- 2552 Oak Tree Ln
- 2615 Oak Tree Ln Unit 2
- 2600 Oak Tree Ln Unit 2
- 4145 Oak Tree Ln
- 2550 Oak Tree Ln
- 2602 Oak Tree Ln Unit 2
- 2604 Oak Tree Ln
- 2546 Oak Tree Ln
- 2606 Oak Tree Ln
Your Personal Tour Guide
Ask me questions while you tour the home.