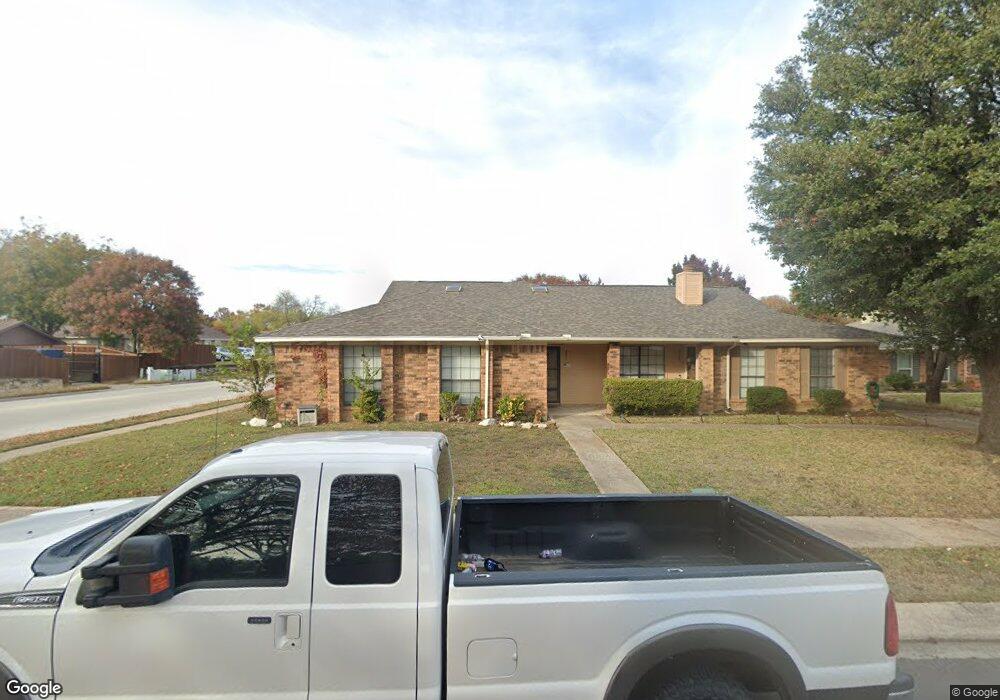
2601 Oakmont Ct Bedford, TX 76022
Estimated Value: $270,307 - $289,000
2
Beds
2
Baths
1,250
Sq Ft
$225/Sq Ft
Est. Value
About This Home
This home is located at 2601 Oakmont Ct, Bedford, TX 76022 and is currently estimated at $280,827, approximately $224 per square foot. 2601 Oakmont Ct is a home located in Tarrant County with nearby schools including Wilshire Elementary School, Harwood Junior High School, and Trinity High School.
Ownership History
Date
Name
Owned For
Owner Type
Purchase Details
Closed on
Aug 22, 2019
Sold by
Bawcom Travis Paul
Bought by
Bawcom Tracy Clifton
Current Estimated Value
Purchase Details
Closed on
Jul 14, 2016
Sold by
Bawcom Travis Paul
Bought by
Bawcom Travis Paul and Bawcom Tracy Clifton
Purchase Details
Closed on
Feb 9, 2016
Sold by
Bawcom Travis Paul
Bought by
Bawcom Travis Paul
Purchase Details
Closed on
May 26, 2005
Sold by
Reeves Ruth H
Bought by
Bawcom G H
Home Financials for this Owner
Home Financials are based on the most recent Mortgage that was taken out on this home.
Original Mortgage
$82,800
Outstanding Balance
$43,421
Interest Rate
5.83%
Mortgage Type
Fannie Mae Freddie Mac
Estimated Equity
$237,406
Purchase Details
Closed on
Mar 12, 1996
Sold by
Shelton Mildred
Bought by
Reeves Ruth H
Create a Home Valuation Report for This Property
The Home Valuation Report is an in-depth analysis detailing your home's value as well as a comparison with similar homes in the area
Home Values in the Area
Average Home Value in this Area
Purchase History
| Date | Buyer | Sale Price | Title Company |
|---|---|---|---|
| Bawcom Tracy Clifton | -- | None Available | |
| Bawcom Travis Paul | -- | Attorney | |
| Bawcom Travis Paul | -- | None Available | |
| Bawcom G H | -- | Stewart Title Co | |
| Reeves Ruth H | -- | Trinity Western Title Co |
Source: Public Records
Mortgage History
| Date | Status | Borrower | Loan Amount |
|---|---|---|---|
| Open | Bawcom G H | $82,800 |
Source: Public Records
Tax History Compared to Growth
Tax History
| Year | Tax Paid | Tax Assessment Tax Assessment Total Assessment is a certain percentage of the fair market value that is determined by local assessors to be the total taxable value of land and additions on the property. | Land | Improvement |
|---|---|---|---|---|
| 2025 | $5,313 | $272,881 | $25,000 | $247,881 |
| 2024 | $5,313 | $272,881 | $25,000 | $247,881 |
| 2023 | $4,957 | $258,452 | $25,000 | $233,452 |
| 2022 | $5,179 | $237,128 | $25,000 | $212,128 |
| 2021 | $4,898 | $207,914 | $25,000 | $182,914 |
| 2020 | $4,177 | $175,683 | $25,000 | $150,683 |
| 2019 | $3,864 | $159,046 | $25,000 | $134,046 |
| 2018 | $3,124 | $128,607 | $25,000 | $103,607 |
| 2017 | $3,257 | $134,631 | $25,000 | $109,631 |
| 2016 | $2,751 | $113,727 | $25,000 | $88,727 |
| 2015 | $1,280 | $99,200 | $11,000 | $88,200 |
| 2014 | $1,280 | $99,200 | $11,000 | $88,200 |
Source: Public Records
Map
Nearby Homes
- 2428 Chestnut Way
- 1116 Highpoint Rd
- 2420 Dalewood Ln
- 1049 Stableway Ln
- 2421 Creek Villas Dr
- 2504 Westpark Way Cir
- 1213 Greendale Dr
- 2201 Greendale Ct
- 828 Gregory Ave
- 2101 Gettysburg Place
- 2620 Britany Cir
- 2024 Charleston Dr
- 2025 Schumac Ln
- 2303 Mcmullin Dr
- 800 Prestwick St
- 808 Gregory Ave
- 2150 Eva Ln
- 952 Charleston Dr
- 1216 Princeton Place
- 804 Natchez Ave
- 2605 Oakmont Ct
- 2605 Oakmont Ct
- 2609 Oakmont Ct
- 2441 Oakmont Dr
- 2600 Chestnut Ct
- 2604 Chestnut Ct
- 2437 Oakmont Dr
- 2613 Oakmont Ct
- 2436 Chestnut Way
- 2600 Oakmont Ct
- 2608 Chestnut Ct
- 2604 Oakmont Ct
- 2612 Chestnut Ct
- 2608 Oakmont Ct
- 2432 Chestnut Way
- 2436 Oakmont Dr
- 2433 Oakmont Dr
- 2612 Oakmont Ct
- 2432 Oakmont Dr
- 2429 Oakmont Dr