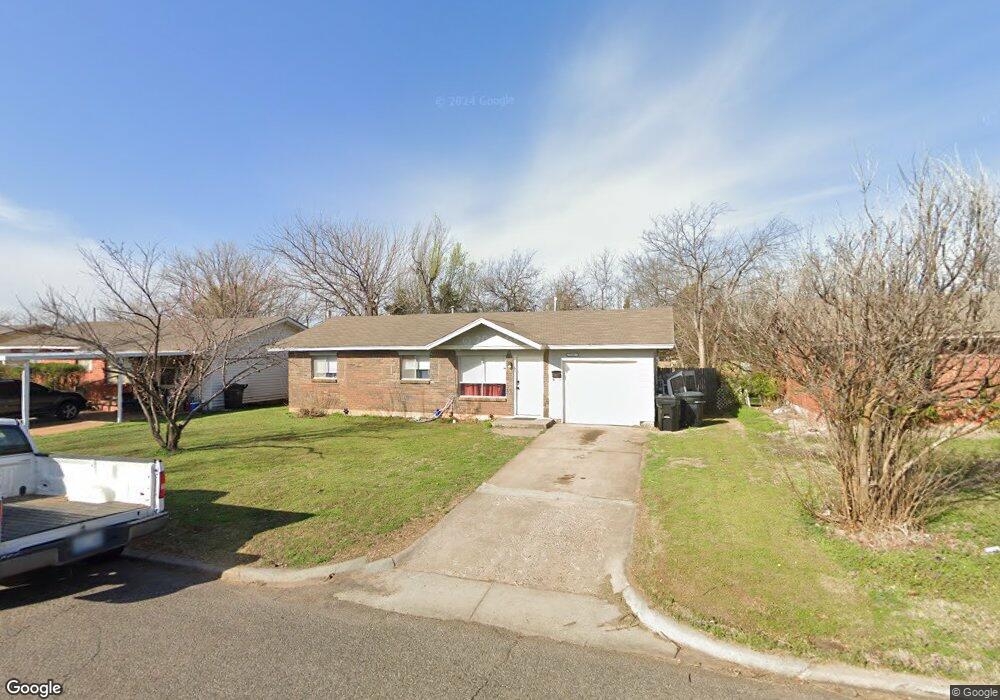
2601 Queensbury Rd Moore, OK 73160
Regency Park NeighborhoodEstimated Value: $120,000 - $161,000
3
Beds
1
Bath
850
Sq Ft
$165/Sq Ft
Est. Value
About This Home
This home is located at 2601 Queensbury Rd, Moore, OK 73160 and is currently estimated at $139,970, approximately $164 per square foot. 2601 Queensbury Rd is a home located in Cleveland County with nearby schools including Houchin Elementary School, Highland West Junior High School, and Southmoore High School.
Ownership History
Date
Name
Owned For
Owner Type
Purchase Details
Closed on
Mar 31, 2017
Sold by
Paul Methvin Homes Inc
Bought by
Methvin Michael P
Current Estimated Value
Purchase Details
Closed on
Oct 3, 2013
Sold by
Ford Phillip Paige and Ford Pamela Lynne
Bought by
Nc Paul Methvin Homesi
Purchase Details
Closed on
Aug 25, 2005
Sold by
Dean Earl M and Dean Helen M
Bought by
Ford Phillip Paige
Home Financials for this Owner
Home Financials are based on the most recent Mortgage that was taken out on this home.
Original Mortgage
$53,000
Interest Rate
5.61%
Mortgage Type
New Conventional
Create a Home Valuation Report for This Property
The Home Valuation Report is an in-depth analysis detailing your home's value as well as a comparison with similar homes in the area
Home Values in the Area
Average Home Value in this Area
Purchase History
| Date | Buyer | Sale Price | Title Company |
|---|---|---|---|
| Methvin Michael P | -- | None Available | |
| Nc Paul Methvin Homesi | $30,000 | The Oklahoma City Abs & Titl | |
| Ford Phillip Paige | $53,000 | None Available |
Source: Public Records
Mortgage History
| Date | Status | Borrower | Loan Amount |
|---|---|---|---|
| Previous Owner | Ford Phillip Paige | $53,000 |
Source: Public Records
Tax History Compared to Growth
Tax History
| Year | Tax Paid | Tax Assessment Tax Assessment Total Assessment is a certain percentage of the fair market value that is determined by local assessors to be the total taxable value of land and additions on the property. | Land | Improvement |
|---|---|---|---|---|
| 2024 | $1,204 | $9,922 | $2,651 | $7,271 |
| 2023 | $1,152 | $9,450 | $2,658 | $6,792 |
| 2022 | $1,114 | $9,000 | $2,793 | $6,207 |
| 2021 | $1,066 | $8,571 | $2,545 | $6,026 |
| 2020 | $1,014 | $8,163 | $1,920 | $6,243 |
| 2019 | $1,033 | $8,163 | $1,920 | $6,243 |
| 2018 | $1,035 | $8,164 | $1,920 | $6,244 |
| 2017 | $1,039 | $8,164 | $0 | $0 |
| 2016 | $1,005 | $7,834 | $1,842 | $5,992 |
| 2015 | $866 | $7,462 | $1,755 | $5,707 |
| 2014 | $844 | $7,106 | $1,080 | $6,026 |
Source: Public Records
Map
Nearby Homes
- 2605 Queensbury Rd
- 912 NW 24th St
- 2404 Piccadilly Cir
- 2829 Larkspur Rd
- 832 NW 23rd St
- 10308 S Broadway Ave
- 5 SW 101st St
- 41 SW 102nd St
- 16313 Dakota Dr
- 24 SW 100th St
- 1024 NW 18th St
- 957 N Windermere Dr
- 10705 S Harvey Ave
- 10108 S Ranchwood Manor Dr
- 1237 N Windermere Dr
- 3523 Victorian Dr
- 936 NW 15th St
- 1612 Dorothy Dr
- 8 E Ranchwood Dr
- 409 SW 102nd St
- 2517 Queensbury Rd
- 2609 Queensbury Rd
- 2513 Queensbury Rd
- 2600 Queensbury Rd
- 2516 Queensbury Rd
- 2604 Queensbury Rd
- 2512 Queensbury Rd
- 2613 Queensbury Rd
- 2608 Queensbury Rd
- 2509 Queensbury Rd
- 2608 Kings Rd
- 2616 Kings Rd
- 2620 Kings Rd
- 2508 Queensbury Rd
- 2604 Kings Rd
- 2612 Queensbury Rd
- 2617 Queensbury Rd
- 2624 Kings Rd
- 2505 Queensbury Rd
- 2600 Kings Rd