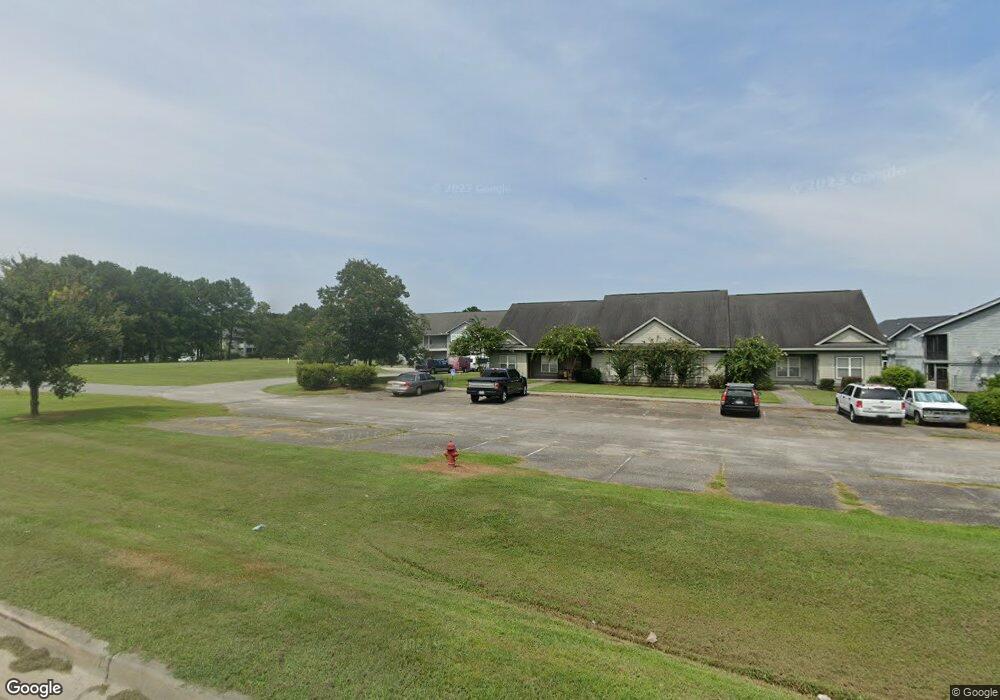
2601 Riverridge Ct Moncks Corner, SC 29461
Estimated Value: $146,000 - $182,000
2
Beds
2
Baths
1,032
Sq Ft
$162/Sq Ft
Est. Value
About This Home
This home is located at 2601 Riverridge Ct, Moncks Corner, SC 29461 and is currently estimated at $167,404, approximately $162 per square foot. 2601 Riverridge Ct is a home located in Berkeley County with nearby schools including Moncks Corner Elementary School, Berkeley Middle School, and Berkeley High School.
Ownership History
Date
Name
Owned For
Owner Type
Purchase Details
Closed on
Oct 4, 2021
Sold by
Worthy Capital Llc
Bought by
Molony Investments Llc
Current Estimated Value
Home Financials for this Owner
Home Financials are based on the most recent Mortgage that was taken out on this home.
Original Mortgage
$94,400
Outstanding Balance
$21,588
Interest Rate
2.8%
Mortgage Type
Purchase Money Mortgage
Estimated Equity
$145,816
Purchase Details
Closed on
Dec 27, 2018
Sold by
Wf Associates Llc
Bought by
Worthy Capital Inc
Purchase Details
Closed on
Feb 20, 2018
Sold by
Dempster Edward A and Dempster Tammy K
Bought by
Wf Associates Llc
Purchase Details
Closed on
Dec 27, 2007
Sold by
Hidden Cove Commons Llc
Bought by
Dempster Edward A and Dempster Tammy K
Home Financials for this Owner
Home Financials are based on the most recent Mortgage that was taken out on this home.
Original Mortgage
$71,000
Interest Rate
7.5%
Mortgage Type
Purchase Money Mortgage
Create a Home Valuation Report for This Property
The Home Valuation Report is an in-depth analysis detailing your home's value as well as a comparison with similar homes in the area
Home Values in the Area
Average Home Value in this Area
Purchase History
| Date | Buyer | Sale Price | Title Company |
|---|---|---|---|
| Molony Investments Llc | $118,000 | Weeks And Irvine Llc | |
| Worthy Capital Inc | -- | None Available | |
| Wf Associates Llc | $310,000 | None Available | |
| Dempster Edward A | -- | Attorney |
Source: Public Records
Mortgage History
| Date | Status | Borrower | Loan Amount |
|---|---|---|---|
| Open | Molony Investments Llc | $94,400 | |
| Previous Owner | Dempster Edward A | $71,000 |
Source: Public Records
Tax History Compared to Growth
Tax History
| Year | Tax Paid | Tax Assessment Tax Assessment Total Assessment is a certain percentage of the fair market value that is determined by local assessors to be the total taxable value of land and additions on the property. | Land | Improvement |
|---|---|---|---|---|
| 2025 | $2,576 | $139,610 | $25,543 | $114,067 |
| 2024 | $2,576 | $8,377 | $1,533 | $6,844 |
| 2023 | $2,576 | $8,377 | $1,533 | $6,844 |
| 2022 | $2,442 | $7,284 | $198 | $7,086 |
| 2021 | $2,096 | $6,380 | $330 | $6,054 |
| 2020 | $2,130 | $6,384 | $330 | $6,054 |
| 2019 | $2,121 | $6,384 | $330 | $6,054 |
| 2018 | $1,191 | $3,354 | $330 | $3,024 |
| 2017 | $1,338 | $3,354 | $330 | $3,024 |
| 2016 | $1,198 | $3,350 | $330 | $3,020 |
| 2015 | $1,110 | $3,350 | $330 | $3,020 |
| 2014 | $1,049 | $3,350 | $330 | $3,020 |
| 2013 | -- | $3,350 | $330 | $3,020 |
Source: Public Records
Map
Nearby Homes
- 2608 Hidden Cove Dr Unit 26H
- 1304 Tailrace Dr
- 295 N U S Highway 52
- 0 Kitfield Rd
- 0 Pou Ct
- 373 Willows Crescent Dr
- 378 Willows Crescent Dr
- 201 Cooper St
- 403 Peachwood Ln
- 220 N Highway 52
- 185 Morning View Way
- 193 Morning View Way
- 347 Willows Crescent Dr
- 414 Blue Elderberry Run
- 168 Morning Vw Way
- 1401 Cooper River Blvd
- 604 Red Mulberry Rd
- 110 Cardinal Flower Ct
- 619 Red Mulberry Rd
- 113 Cardinal Flower Ct
- 2601 Riverridge Ct
- 2601 Riverridge Ct
- 2601 Riverridge Ct
- 2601 Riverridge Ct Unit 22D
- 2601 Riverridge Ct
- 2601 Riverridge Ct Unit 22H
- 2601 Riverridge Ct Unit H
- 2601 Riverridge Ct Unit D2
- 2601 Riverridge Ct Unit D
- 2601 Riverridge Ct Unit C
- 2601 Riverridge Ct Unit G
- 2601 Riverridge Ct Unit F
- 2601 Riverridge Ct Unit E
- 2601 Riverridge Ct Unit B
- 2601 Riverridge Ct
- 2502 Riverridge Ct Unit 2L
- 2501 Riverridge Ct
- 2403 Riverridge Ct
- 2503 Riverridge Ct Unit 3L
- 2504 Riverridge Ct Unit 4L