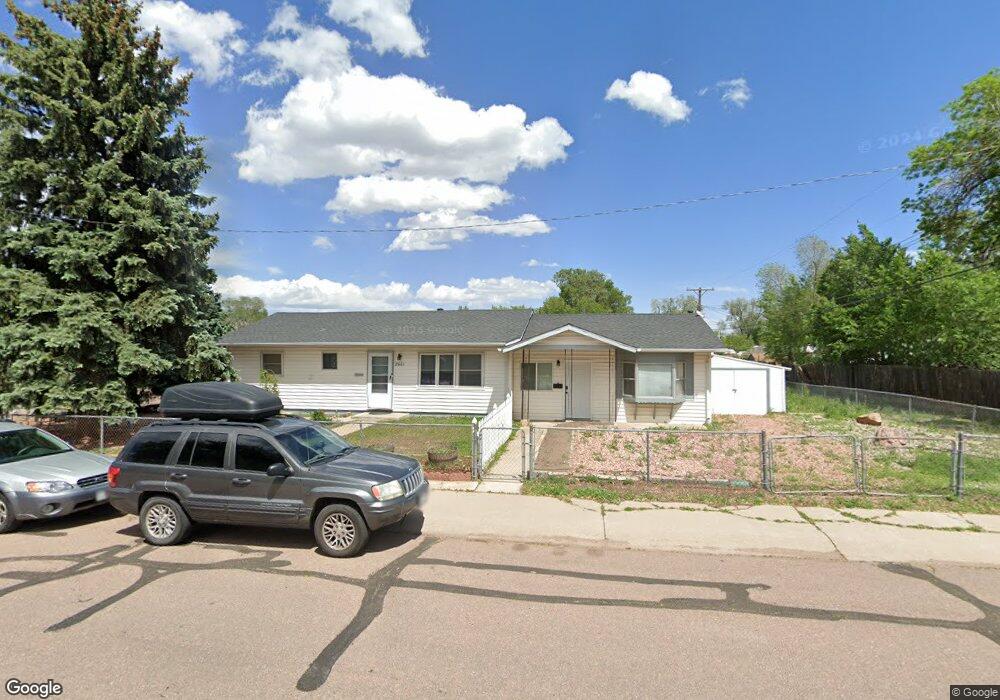
2601 S Hancock Ave Unit A Colorado Springs, CO 80905
Stratton Meadows NeighborhoodEstimated Value: $354,000 - $386,000
3
Beds
1
Bath
1,422
Sq Ft
$259/Sq Ft
Est. Value
About This Home
This home is located at 2601 S Hancock Ave Unit A, Colorado Springs, CO 80905 and is currently estimated at $368,884, approximately $259 per square foot. 2601 S Hancock Ave Unit A is a home located in El Paso County with nearby schools including Stratton Meadows Elementary School, Fox Meadow Middle School, and Harrison High School.
Ownership History
Date
Name
Owned For
Owner Type
Purchase Details
Closed on
Nov 29, 2023
Sold by
Coon Alysha K
Bought by
Urquhart Samuel Joseph and Isley Autumn Lynn
Current Estimated Value
Home Financials for this Owner
Home Financials are based on the most recent Mortgage that was taken out on this home.
Original Mortgage
$349,000
Outstanding Balance
$343,350
Interest Rate
7.63%
Mortgage Type
New Conventional
Estimated Equity
$25,534
Purchase Details
Closed on
Aug 15, 2019
Sold by
Harvey Janice Elaine
Bought by
Coon Alysha K
Home Financials for this Owner
Home Financials are based on the most recent Mortgage that was taken out on this home.
Original Mortgage
$213,400
Interest Rate
3.7%
Mortgage Type
New Conventional
Purchase Details
Closed on
Jun 1, 2015
Sold by
Kernen Shirley J and Harvey Janice E
Bought by
Newby Thelma
Purchase Details
Closed on
May 19, 2012
Sold by
Newby Thelma
Bought by
Kenen Shirley J and Harvey Janice E
Create a Home Valuation Report for This Property
The Home Valuation Report is an in-depth analysis detailing your home's value as well as a comparison with similar homes in the area
Home Values in the Area
Average Home Value in this Area
Purchase History
| Date | Buyer | Sale Price | Title Company |
|---|---|---|---|
| Urquhart Samuel Joseph | $377,500 | Fntc | |
| Coon Alysha K | $220,000 | Empire Title Co Springs Llc | |
| Newby Thelma | -- | None Available | |
| Kenen Shirley J | -- | None Available |
Source: Public Records
Mortgage History
| Date | Status | Borrower | Loan Amount |
|---|---|---|---|
| Open | Urquhart Samuel Joseph | $349,000 | |
| Previous Owner | Coon Alysha K | $213,400 |
Source: Public Records
Tax History Compared to Growth
Tax History
| Year | Tax Paid | Tax Assessment Tax Assessment Total Assessment is a certain percentage of the fair market value that is determined by local assessors to be the total taxable value of land and additions on the property. | Land | Improvement |
|---|---|---|---|---|
| 2025 | $1,145 | $25,020 | -- | -- |
| 2024 | $884 | $23,540 | $3,030 | $20,510 |
| 2022 | $879 | $16,300 | $2,430 | $13,870 |
| 2021 | $939 | $16,770 | $2,500 | $14,270 |
| 2020 | $858 | $13,160 | $2,150 | $11,010 |
| 2019 | $831 | $13,160 | $2,150 | $11,010 |
| 2018 | $679 | $10,350 | $1,730 | $8,620 |
| 2017 | $519 | $10,350 | $1,730 | $8,620 |
| 2016 | $494 | $9,260 | $1,510 | $7,750 |
| 2015 | $494 | $9,260 | $1,510 | $7,750 |
| 2014 | $476 | $8,820 | $1,510 | $7,310 |
Source: Public Records
Map
Nearby Homes
- 1304 Pando Ave
- 1216 Norwood Ave
- 1205 Montrose Ave
- 1309 Florence Ave
- 1315 Pando Ave
- 1117 Montrose Ave
- 916 Tenderfoot Hill Rd Unit 101
- 1224 La Junta Ave
- 846 Tenderfoot Hill Rd Unit 104
- 846 Tenderfoot Hill Rd Unit 202
- 2768 La Strada Grande Heights
- 840 Tenderfoot Hill Rd
- 840 Tenderfoot Hill Rd Unit 201
- 850 Tenderfoot Hill Rd Unit 103
- 1222 Bristol Ave
- 1052 Florence Ave
- 1117 Mount Werner Cir
- 2127 S Corona Ave
- 2415 Byers Ave
- 1036 Florence Ave
- 2601 S Hancock Ave
- 1203 Pando Ave
- 2605 S Hancock Ave
- 1139 Pando Ave
- 1204 Rockwood Ave
- 1205 Pando Ave
- 2505 S Hancock Ave
- 1140 Rockwood Ave
- 1206 Rockwood Ave
- 1204 Pando Ave
- 1207 Pando Ave
- 1140 Pando Ave
- 1206 Pando Ave
- 1208 Rockwood Ave
- 1138 Rockwood Ave
- 1138 Pando Ave
- 1208 Pando Ave
- 1209 Pando Ave
- 1160 Pando Ave Unit Drive
- Various Rockwood St