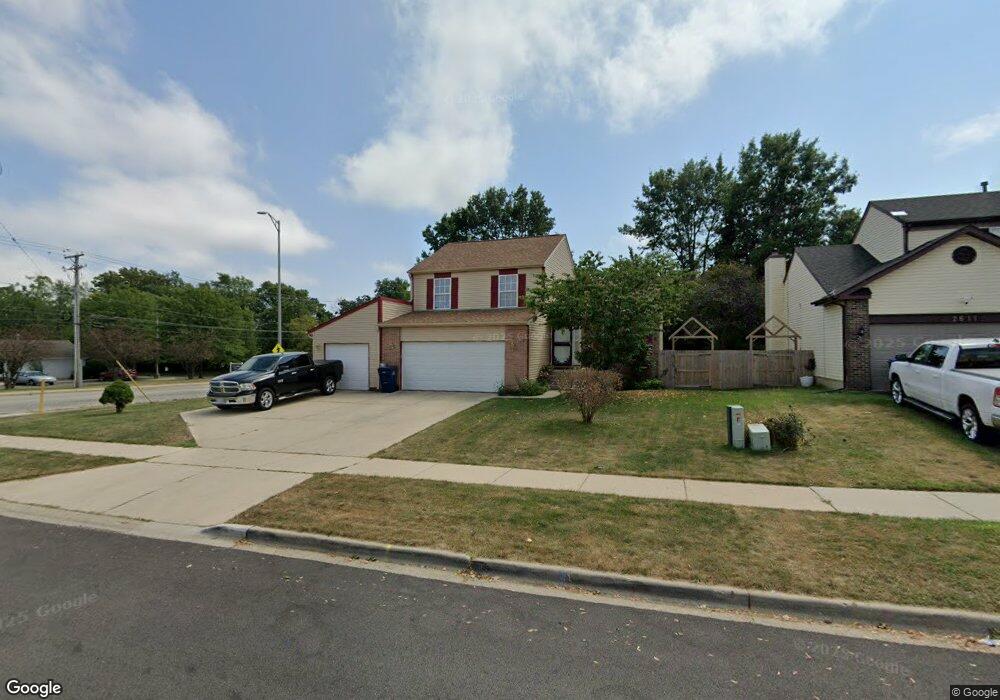
2601 W Atlantic Ave Waukegan, IL 60085
Estimated Value: $296,000 - $364,000
3
Beds
2
Baths
1,456
Sq Ft
$220/Sq Ft
Est. Value
About This Home
This home is located at 2601 W Atlantic Ave, Waukegan, IL 60085 and is currently estimated at $320,637, approximately $220 per square foot. 2601 W Atlantic Ave is a home located in Lake County with nearby schools including Clearview Elementary School, Miguel Juarez Middle School, and Waukegan High School.
Ownership History
Date
Name
Owned For
Owner Type
Purchase Details
Closed on
Sep 17, 2018
Sold by
Glover Lorraine and Glover Harris Lorraine
Bought by
Glover Harris Lorraine and Harris Howard A
Current Estimated Value
Home Financials for this Owner
Home Financials are based on the most recent Mortgage that was taken out on this home.
Original Mortgage
$162,500
Outstanding Balance
$117,245
Interest Rate
4.37%
Mortgage Type
New Conventional
Estimated Equity
$203,392
Purchase Details
Closed on
Apr 12, 2006
Sold by
Glover Leila
Bought by
Glover Lorraine
Home Financials for this Owner
Home Financials are based on the most recent Mortgage that was taken out on this home.
Original Mortgage
$160,800
Interest Rate
7.9%
Mortgage Type
Balloon
Purchase Details
Closed on
Jun 16, 1995
Sold by
Parkway Bank & Trust Company
Bought by
Glover Lorraine and Glover Leila
Home Financials for this Owner
Home Financials are based on the most recent Mortgage that was taken out on this home.
Original Mortgage
$103,800
Interest Rate
7.9%
Create a Home Valuation Report for This Property
The Home Valuation Report is an in-depth analysis detailing your home's value as well as a comparison with similar homes in the area
Home Values in the Area
Average Home Value in this Area
Purchase History
| Date | Buyer | Sale Price | Title Company |
|---|---|---|---|
| Glover Harris Lorraine | -- | Servicelink | |
| Glover Lorraine | -- | Alliance Title | |
| Glover Lorraine | $115,500 | Chicago Title Insurance Co |
Source: Public Records
Mortgage History
| Date | Status | Borrower | Loan Amount |
|---|---|---|---|
| Open | Glover Harris Lorraine | $162,500 | |
| Closed | Glover Lorraine | $160,800 | |
| Closed | Glover Lorraine | $103,800 |
Source: Public Records
Tax History Compared to Growth
Tax History
| Year | Tax Paid | Tax Assessment Tax Assessment Total Assessment is a certain percentage of the fair market value that is determined by local assessors to be the total taxable value of land and additions on the property. | Land | Improvement |
|---|---|---|---|---|
| 2024 | $6,664 | $80,568 | $15,365 | $65,203 |
| 2023 | $6,585 | $70,669 | $13,408 | $57,261 |
| 2022 | $6,585 | $67,355 | $14,476 | $52,879 |
| 2021 | $6,280 | $60,233 | $12,912 | $47,321 |
| 2020 | $6,361 | $56,114 | $12,029 | $44,085 |
| 2019 | $6,402 | $51,420 | $11,023 | $40,397 |
| 2018 | $6,309 | $55,175 | $16,080 | $39,095 |
| 2017 | $6,090 | $48,814 | $14,226 | $34,588 |
| 2016 | $4,978 | $38,216 | $11,138 | $27,078 |
| 2015 | $4,764 | $34,204 | $9,969 | $24,235 |
| 2014 | $4,035 | $29,391 | $7,284 | $22,107 |
| 2012 | $5,222 | $31,842 | $7,891 | $23,951 |
Source: Public Records
Map
Nearby Homes
- 2810 W Atlantic Ave
- 2715 W Greenwood Ave
- 12352 W Atlantic Ave
- 2440 W Cheyenne Rd
- 2813 Theresa Ave
- 2207 Williamsburg Dr
- 1913 Chippewa Rd
- 2008 Harding Ave
- 2009 Harding Ave
- 2928 W Country Club Ave
- 3000 W Country Club Ave
- 2946 W Country Club Ave
- 1005 N Lewis Ave
- 1038 Indiana Ave
- 1023 N Elmwood Ave
- 3320 Sunset Ave
- 1117 Judge Ave
- 2713 Varonen Ave
- 1504 W Glen Flora Ave
- 968 Judge Ave
- 2611 W Atlantic Ave
- 2621 W Atlantic Ave
- 2602 W Atlantic Ave
- 2631 W Atlantic Ave
- 2612 W Atlantic Ave
- 2622 W Atlantic Ave
- 2641 W Atlantic Ave
- 2632 W Atlantic Ave
- 1605 N Mcaree Rd
- 1521 N Mcaree Rd
- 2642 W Atlantic Ave
- 2651 W Atlantic Ave
- 2652 W Atlantic Ave
- 2661 W Atlantic Ave
- 1519 N Mcaree Rd
- 2662 W Atlantic Ave
- 2671 W Atlantic Ave
- 1509 N Mcaree Rd
- 2620 Peppertree Ln
- 2672 W Atlantic Ave