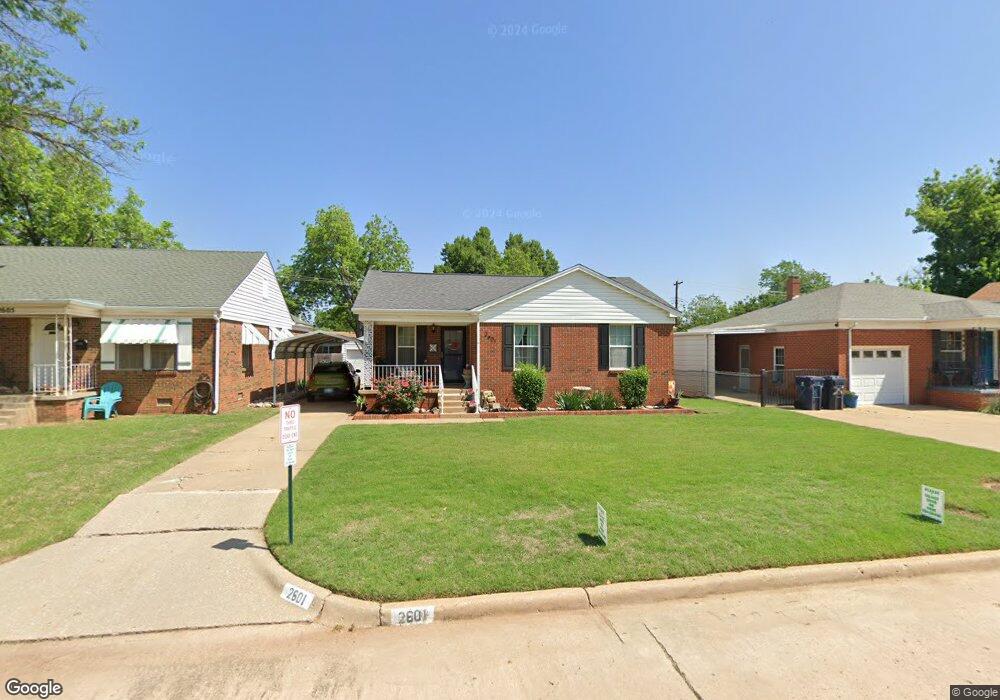
2601 W Eubanks St Oklahoma City, OK 73112
Venice NeighborhoodEstimated Value: $152,783 - $173,000
2
Beds
1
Bath
1,026
Sq Ft
$159/Sq Ft
Est. Value
About This Home
This home is located at 2601 W Eubanks St, Oklahoma City, OK 73112 and is currently estimated at $163,446, approximately $159 per square foot. 2601 W Eubanks St is a home located in Oklahoma County with nearby schools including Cleveland Elementary School, Taft Middle School, and Northwest Classen High School.
Ownership History
Date
Name
Owned For
Owner Type
Purchase Details
Closed on
Feb 11, 2013
Sold by
Cribbs Amanda and Cribbs Jarod S
Bought by
Cribbs Amanda and Cribbs Jarod S
Current Estimated Value
Home Financials for this Owner
Home Financials are based on the most recent Mortgage that was taken out on this home.
Original Mortgage
$64,800
Outstanding Balance
$46,004
Interest Rate
3.75%
Mortgage Type
FHA
Estimated Equity
$117,442
Purchase Details
Closed on
Mar 31, 2009
Sold by
Funnell Loyce A and Loyce A Funnell 2000 Revocable
Bought by
Hoppers Amanda L
Home Financials for this Owner
Home Financials are based on the most recent Mortgage that was taken out on this home.
Original Mortgage
$68,732
Interest Rate
5.24%
Mortgage Type
FHA
Purchase Details
Closed on
Nov 9, 2000
Sold by
Funnell Loyce A
Bought by
Funnell Loyce A and The Loyce A Funnell 2000 Revocable Trust
Purchase Details
Closed on
Apr 6, 2000
Sold by
Funnell James D and Funnell Loyce A
Bought by
Funnell Loyce A
Create a Home Valuation Report for This Property
The Home Valuation Report is an in-depth analysis detailing your home's value as well as a comparison with similar homes in the area
Home Values in the Area
Average Home Value in this Area
Purchase History
| Date | Buyer | Sale Price | Title Company |
|---|---|---|---|
| Cribbs Amanda | -- | The Oklahoma City Abs & Tit | |
| Hoppers Amanda L | $70,000 | Capitol Abstract & Title Co | |
| Funnell Loyce A | -- | -- | |
| Funnell Loyce A | -- | -- |
Source: Public Records
Mortgage History
| Date | Status | Borrower | Loan Amount |
|---|---|---|---|
| Open | Cribbs Amanda | $64,800 | |
| Closed | Hoppers Amanda L | $68,732 |
Source: Public Records
Tax History Compared to Growth
Tax History
| Year | Tax Paid | Tax Assessment Tax Assessment Total Assessment is a certain percentage of the fair market value that is determined by local assessors to be the total taxable value of land and additions on the property. | Land | Improvement |
|---|---|---|---|---|
| 2024 | $1,336 | $11,424 | $1,930 | $9,494 |
| 2023 | $1,336 | $10,880 | $1,994 | $8,886 |
| 2022 | $1,219 | $10,360 | $2,186 | $8,174 |
| 2021 | $1,161 | $9,867 | $2,241 | $7,626 |
| 2020 | $1,119 | $9,398 | $2,655 | $6,743 |
| 2019 | $1,065 | $8,951 | $2,774 | $6,177 |
| 2018 | $967 | $8,525 | $0 | $0 |
| 2017 | $966 | $8,524 | $2,983 | $5,541 |
| 2016 | $930 | $8,198 | $2,331 | $5,867 |
| 2015 | $894 | $7,807 | $2,345 | $5,462 |
| 2014 | $865 | $7,596 | $2,345 | $5,251 |
Source: Public Records
Map
Nearby Homes
- 2525 NW 35th St
- 2441 NW 35th St
- 2517 NW 38th St
- 3800 Key Place
- 2713 NW 37th St
- 2616 NW 33rd St
- 3824 Key Place
- 2332 NW 36th St
- 2621 NW 32nd St
- 2728 NW 38th St
- 2721 NW 33rd St
- 2537 NW 31st St
- 2410 NW 32nd St
- 2705 NW 31st St
- 2600 Cashion Place
- 3201 Winter Dr
- 2243 NW 32nd St
- 2737 Cashion Place
- 3004 N Venice Blvd
- 3000 NW 34th St
- 2605 W Eubanks St
- 2549 W Eubanks St
- 2609 W Eubanks St
- 2548 NW 36th St
- 2541 W Eubanks St
- 2604 NW 36th St
- 2613 W Eubanks St
- 2608 NW 36th St
- 2544 NW 36th St
- 2600 W Eubanks St
- 2537 W Eubanks St
- 2548 W Eubanks St
- 2604 W Eubanks St
- 2540 NW 36th St
- 2617 W Eubanks St
- 2612 NW 36th St
- 2544 W Eubanks St
- 2608 W Eubanks St
- 2540 W Eubanks St
- 2536 NW 36th St