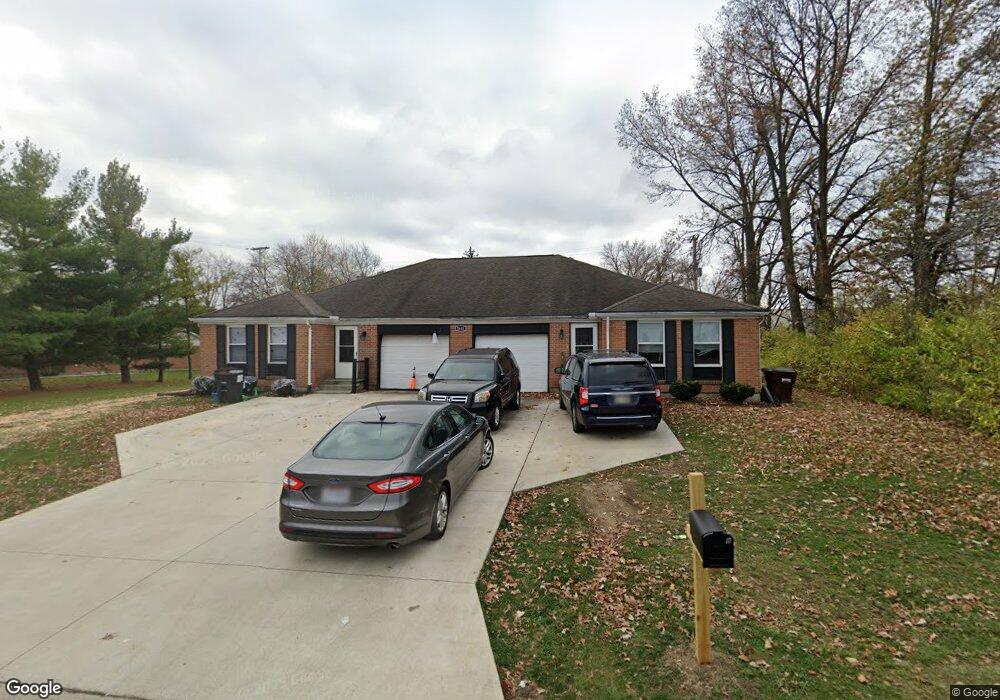
2601 W Market St Lima, OH 45805
Lakewood West NeighborhoodEstimated Value: $256,000 - $297,000
6
Beds
4
Baths
2,480
Sq Ft
$111/Sq Ft
Est. Value
About This Home
This home is located at 2601 W Market St, Lima, OH 45805 and is currently estimated at $275,236, approximately $110 per square foot. 2601 W Market St is a home located in Allen County with nearby schools including Maplewood Elementary School, Elmwood Elementary School, and Shawnee Middle School.
Ownership History
Date
Name
Owned For
Owner Type
Purchase Details
Closed on
Jan 25, 2018
Sold by
Fisher Investment Property Inc
Bought by
Serenity Investment Properties Inc
Current Estimated Value
Purchase Details
Closed on
May 22, 2000
Sold by
B & B Enterprises Inc
Bought by
Fisher Todd L and Fisher Tamara S
Home Financials for this Owner
Home Financials are based on the most recent Mortgage that was taken out on this home.
Original Mortgage
$504,800
Interest Rate
8.21%
Mortgage Type
New Conventional
Purchase Details
Closed on
Jul 1, 1983
Bought by
Best Michael D
Create a Home Valuation Report for This Property
The Home Valuation Report is an in-depth analysis detailing your home's value as well as a comparison with similar homes in the area
Home Values in the Area
Average Home Value in this Area
Purchase History
| Date | Buyer | Sale Price | Title Company |
|---|---|---|---|
| Serenity Investment Properties Inc | -- | None Available | |
| Fisher Todd L | $550,000 | -- | |
| Best Michael D | $462,000 | -- |
Source: Public Records
Mortgage History
| Date | Status | Borrower | Loan Amount |
|---|---|---|---|
| Previous Owner | Fisher Todd L | $504,800 |
Source: Public Records
Tax History Compared to Growth
Tax History
| Year | Tax Paid | Tax Assessment Tax Assessment Total Assessment is a certain percentage of the fair market value that is determined by local assessors to be the total taxable value of land and additions on the property. | Land | Improvement |
|---|---|---|---|---|
| 2024 | $3,971 | $85,760 | $12,500 | $73,260 |
| 2023 | $3,660 | $69,720 | $10,150 | $59,570 |
| 2022 | $3,654 | $69,720 | $10,150 | $59,570 |
| 2021 | $3,665 | $69,720 | $10,150 | $59,570 |
| 2020 | $2,899 | $57,680 | $9,660 | $48,020 |
| 2019 | $2,899 | $57,680 | $9,660 | $48,020 |
| 2018 | $2,812 | $57,680 | $9,660 | $48,020 |
| 2017 | $2,768 | $53,310 | $9,660 | $43,650 |
| 2016 | $2,783 | $53,310 | $9,660 | $43,650 |
| 2015 | $2,575 | $53,310 | $9,660 | $43,650 |
| 2014 | $2,575 | $49,810 | $9,450 | $40,360 |
| 2013 | $2,332 | $49,810 | $9,450 | $40,360 |
Source: Public Records
Map
Nearby Homes
- 2700 Lowell Ave
- 391 N Fernwood Dr
- 209 N Dale Dr
- 704 Bentwood Dr
- N/A Eastown Rd N
- 2958 Hanover Dr
- 2050 W Market St
- 2964 Hanover Dr
- 2925 Koop Rd
- 2940 Koop Rd
- 2921 Canterbury Dr
- 234 S Westwood Dr
- 2035 W Wayne St
- 2956 W High St
- 514 N Cable Rd
- 1880 Wendell Ave
- 1912 Hillcrest Dr
- 2100 University Blvd
- 608 S Primrose Place
- 2997 Cletus Pkwy