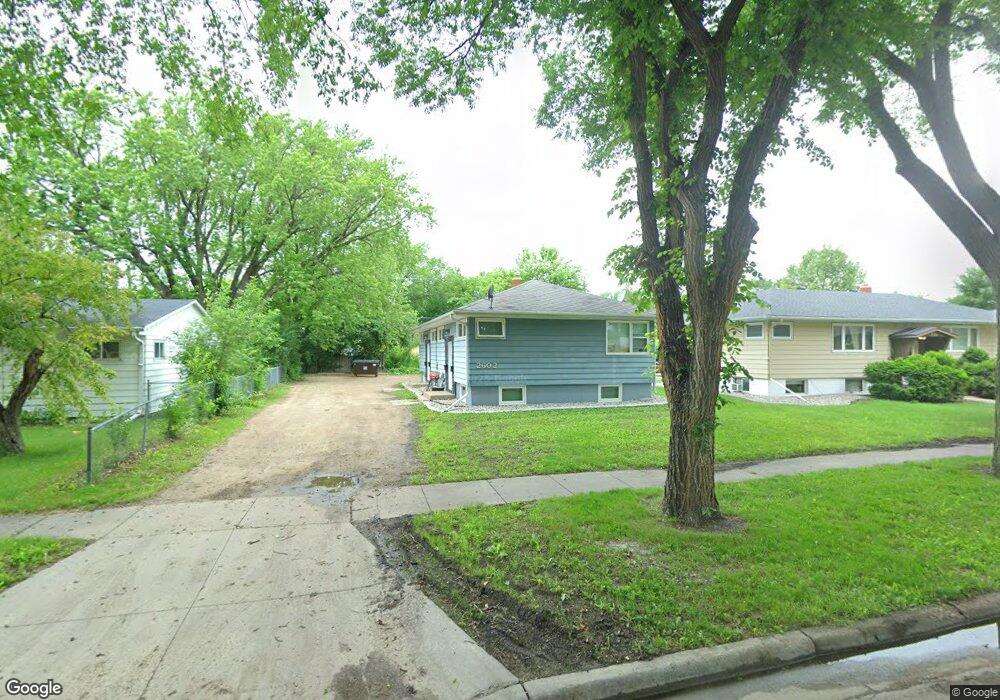
2602 9th St N Fargo, ND 58102
Northport NeighborhoodEstimated Value: $221,000 - $263,000
3
Beds
2
Baths
2,080
Sq Ft
$118/Sq Ft
Est. Value
About This Home
This home is located at 2602 9th St N, Fargo, ND 58102 and is currently estimated at $244,775, approximately $117 per square foot. 2602 9th St N is a home located in Cass County with nearby schools including McKinley Elementary School, Ben Franklin Middle School, and North High School.
Create a Home Valuation Report for This Property
The Home Valuation Report is an in-depth analysis detailing your home's value as well as a comparison with similar homes in the area
Home Values in the Area
Average Home Value in this Area
Tax History Compared to Growth
Tax History
| Year | Tax Paid | Tax Assessment Tax Assessment Total Assessment is a certain percentage of the fair market value that is determined by local assessors to be the total taxable value of land and additions on the property. | Land | Improvement |
|---|---|---|---|---|
| 2024 | $3,587 | $109,200 | $12,500 | $96,700 |
| 2023 | $3,550 | $109,200 | $12,500 | $96,700 |
| 2022 | $3,174 | $94,950 | $12,500 | $82,450 |
| 2021 | $2,866 | $86,300 | $12,500 | $73,800 |
| 2020 | $2,597 | $83,000 | $12,500 | $70,500 |
| 2019 | $2,509 | $83,000 | $9,000 | $74,000 |
| 2018 | $2,450 | $83,000 | $9,000 | $74,000 |
| 2017 | $2,110 | $72,000 | $9,000 | $63,000 |
| 2016 | $2,069 | $72,000 | $7,000 | $65,000 |
| 2015 | $2,210 | $67,850 | $7,000 | $60,850 |
| 2014 | $1,994 | $59,000 | $7,000 | $52,000 |
| 2013 | $2,016 | $59,400 | $7,000 | $52,400 |
Source: Public Records
Map
Nearby Homes
- 2510 10th St N
- 2214 9 1 2 St N
- 418 25th Ave N
- 310 27th Ave N
- 1914 9th St N
- 501 Forest Ave N Unit C
- 2902 3rd St N
- 2807 Edgewood Dr N
- 2512 2nd St N
- 207 23rd Ave N
- 305 19th Ave N
- 3113 8th St N
- 101 27th Ave N
- 3129 8th St N
- 1822 3rd St N
- 87 28th Ave N
- 314 18th Ave N
- 801 32nd Ave N Unit A102
- 3216 Broadway N
- 2926 Edgewood Dr N
- 2602 9th St N
- 2602 9th St N
- 2606 9th St N
- 2606 9th St N
- 2606 9th St N
- 2514 9th St N
- 2610 9th St N
- 2512 9th St N Unit 4
- 2512 9th St N
- 2512 9th St N
- 2605 9 1/2 St N
- 2601 9th St N
- 2601 9th St N
- 2515 9th St N
- 2513 9 1/2 St N
- 2605 9th St N Unit 1
- 2605 9th St N Unit 4
- 2605 9th St N
- 2513 9th St N
- 2613 9 1/2 St N