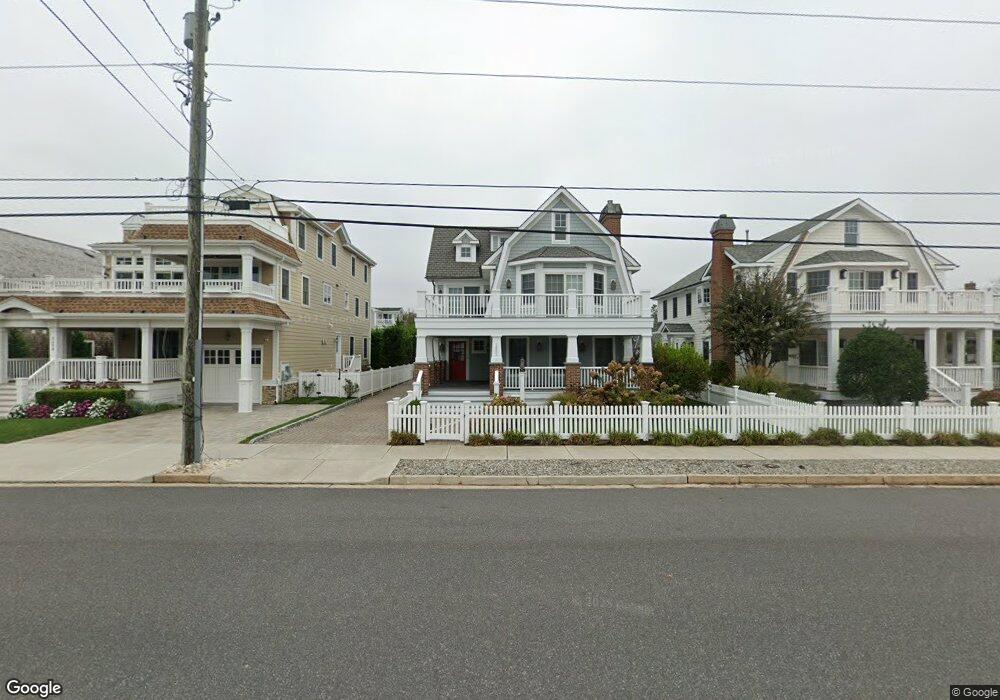
2602 Avalon Ave Avalon, NJ 08202
Estimated Value: $4,075,000 - $4,962,000
Studio
--
Bath
3,426
Sq Ft
$1,289/Sq Ft
Est. Value
About This Home
This home is located at 2602 Avalon Ave, Avalon, NJ 08202 and is currently estimated at $4,415,316, approximately $1,288 per square foot. 2602 Avalon Ave is a home located in Cape May County with nearby schools including Avalon Elementary School.
Ownership History
Date
Name
Owned For
Owner Type
Purchase Details
Closed on
Dec 29, 2009
Sold by
Hneleski Ignatius S and Hneleski Edna Wynne
Bought by
2602 Avalon Ave Hneleski Flp Lp
Current Estimated Value
Purchase Details
Closed on
Sep 9, 2002
Sold by
Shute Thomas A
Bought by
Hneleski Ignatius S and Hneleski Edna Wynne
Purchase Details
Closed on
Jan 12, 2001
Sold by
Pasquale Samuel J Di
Bought by
Shute Thomas A
Home Financials for this Owner
Home Financials are based on the most recent Mortgage that was taken out on this home.
Original Mortgage
$1,200,000
Interest Rate
7.39%
Purchase Details
Closed on
Sep 15, 1989
Sold by
Menapace Margaret
Bought by
Dipasquale Samuel
Create a Home Valuation Report for This Property
The Home Valuation Report is an in-depth analysis detailing your home's value as well as a comparison with similar homes in the area
Home Values in the Area
Average Home Value in this Area
Purchase History
| Date | Buyer | Sale Price | Title Company |
|---|---|---|---|
| 2602 Avalon Ave Hneleski Flp Lp | -- | None Available | |
| Hneleski Ignatius S | $700,000 | -- | |
| Shute Thomas A | $1,200,000 | -- | |
| Dipasquale Samuel | $495,000 | -- |
Source: Public Records
Mortgage History
| Date | Status | Borrower | Loan Amount |
|---|---|---|---|
| Previous Owner | Shute Thomas A | $1,200,000 |
Source: Public Records
Tax History
| Year | Tax Paid | Tax Assessment Tax Assessment Total Assessment is a certain percentage of the fair market value that is determined by local assessors to be the total taxable value of land and additions on the property. | Land | Improvement |
|---|---|---|---|---|
| 2025 | $13,539 | $2,205,000 | $1,300,000 | $905,000 |
| 2024 | $13,539 | $2,205,000 | $1,300,000 | $905,000 |
| 2023 | $13,428 | $2,205,000 | $1,300,000 | $905,000 |
| 2022 | $12,524 | $2,205,000 | $1,300,000 | $905,000 |
| 2021 | $12,061 | $2,205,000 | $1,300,000 | $905,000 |
| 2020 | $11,598 | $2,205,000 | $1,300,000 | $905,000 |
| 2019 | $11,246 | $2,205,000 | $1,300,000 | $905,000 |
| 2018 | $10,760 | $2,205,000 | $1,300,000 | $905,000 |
| 2017 | $10,111 | $1,818,600 | $1,000,000 | $818,600 |
| 2016 | $10,002 | $1,818,600 | $1,000,000 | $818,600 |
| 2015 | $9,839 | $1,818,600 | $1,000,000 | $818,600 |
| 2014 | $9,730 | $1,818,600 | $1,000,000 | $818,600 |
Source: Public Records
Map
Nearby Homes
- 8 27th St Unit West
- 29 28th St E Unit 7
- 74 26th St E
- 2958 Avalon Ave
- 53 25th St E
- 2968 First Ave
- 2988 1st Ave
- 179 27th St
- 25 32nd St W
- 55 32nd St W Unit C2B
- 55 32nd St W
- 55 32nd St W Unit 1A
- 3149 First Ave
- 161 24th St
- 174 23rd St
- 212 25th St Unit End Unit
- 118 22nd St
- 179 32nd St
- 76 21st St W
- 158 32nd St
Your Personal Tour Guide
Ask me questions while you tour the home.