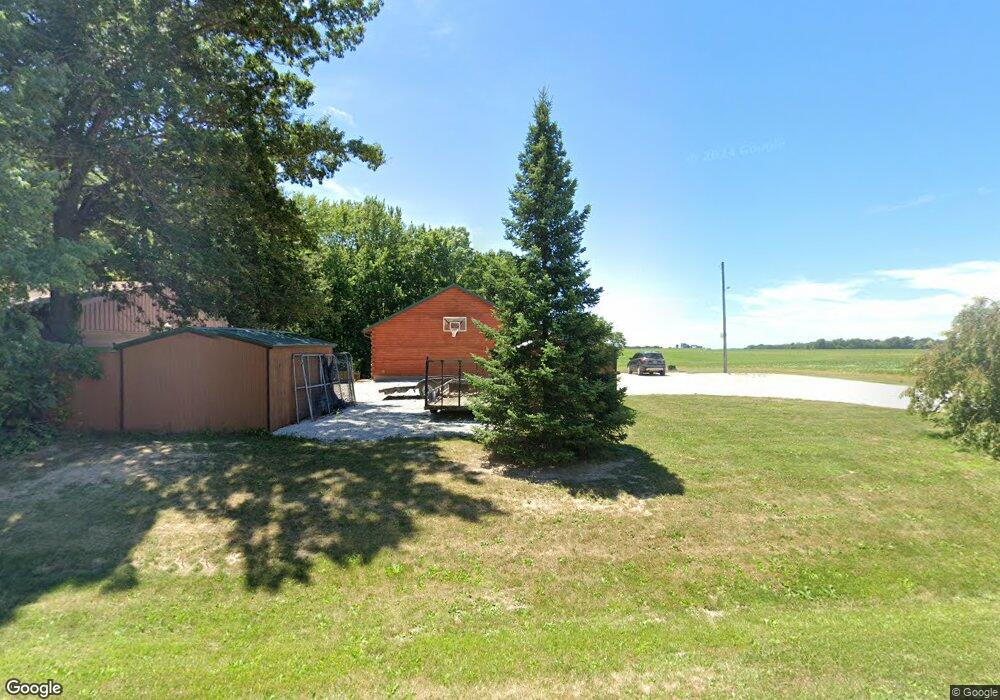
2602 E 1800 North Rd Moweaqua, IL 62550
Estimated Value: $345,000 - $374,355
5
Beds
3
Baths
1,860
Sq Ft
$197/Sq Ft
Est. Value
About This Home
This home is located at 2602 E 1800 North Rd, Moweaqua, IL 62550 and is currently estimated at $365,589, approximately $196 per square foot. 2602 E 1800 North Rd is a home located in Christian County with nearby schools including Central A&M High School.
Ownership History
Date
Name
Owned For
Owner Type
Purchase Details
Closed on
Oct 7, 2021
Sold by
Enge Christine D and Enge Christopher
Bought by
Snearly Shane and Snearly Jill
Current Estimated Value
Home Financials for this Owner
Home Financials are based on the most recent Mortgage that was taken out on this home.
Original Mortgage
$280,250
Outstanding Balance
$255,562
Interest Rate
2.8%
Mortgage Type
Purchase Money Mortgage
Estimated Equity
$110,027
Purchase Details
Closed on
Jun 4, 2018
Sold by
Brady Steven E and Brady Laurie M
Bought by
Enge Christine D
Home Financials for this Owner
Home Financials are based on the most recent Mortgage that was taken out on this home.
Original Mortgage
$224,000
Interest Rate
4.5%
Mortgage Type
Purchase Money Mortgage
Purchase Details
Closed on
May 18, 2015
Bought by
Long Alan D and Long Andrea J
Create a Home Valuation Report for This Property
The Home Valuation Report is an in-depth analysis detailing your home's value as well as a comparison with similar homes in the area
Home Values in the Area
Average Home Value in this Area
Purchase History
| Date | Buyer | Sale Price | Title Company |
|---|---|---|---|
| Snearly Shane | $295,500 | None Available | |
| Enge Christine D | -- | -- | |
| Long Alan D | $240,000 | -- |
Source: Public Records
Mortgage History
| Date | Status | Borrower | Loan Amount |
|---|---|---|---|
| Open | Snearly Shane | $280,250 | |
| Previous Owner | Enge Christine D | $224,000 |
Source: Public Records
Tax History Compared to Growth
Tax History
| Year | Tax Paid | Tax Assessment Tax Assessment Total Assessment is a certain percentage of the fair market value that is determined by local assessors to be the total taxable value of land and additions on the property. | Land | Improvement |
|---|---|---|---|---|
| 2024 | $6,772 | $96,405 | $8,927 | $87,478 |
| 2023 | $6,207 | $90,521 | $8,382 | $82,139 |
| 2022 | $5,731 | $83,047 | $7,690 | $75,357 |
| 2021 | $5,636 | $81,497 | $6,160 | $75,337 |
| 2020 | $5,653 | $81,497 | $6,160 | $75,337 |
| 2019 | $5,800 | $81,497 | $6,160 | $75,337 |
| 2018 | $5,531 | $78,756 | $5,953 | $72,803 |
| 2017 | $5,585 | $79,016 | $6,109 | $72,907 |
| 2016 | $5,472 | $77,466 | $5,989 | $71,477 |
| 2015 | $5,281 | $74,386 | $5,751 | $68,635 |
| 2014 | $5,012 | $72,820 | $5,630 | $67,190 |
| 2013 | $5,175 | $74,610 | $5,547 | $69,063 |
| 2011 | $6,471 | $91,720 | $5,547 | $86,173 |
Source: Public Records
Map
Nearby Homes
- 241 W Main St
- 317 W Madison St
- 319 N Macon St
- 333 N Macon St
- 320 E Elm St
- 429 N Shelby St
- 0 E Main St
- 803 N Putnam St
- 2 Sunnyside Estate
- 501 W Walker Rd Unit Macon Illinois 62544
- 325 N Poplar St
- 647 E 2100 Rd N
- 225 E North St
- 107 S Saint John St
- 107 S Oak St
- 116 S Saint John St
- 120 S Walnut St
- 207 Kemmerer St
- 2421 SW Test Listing Bayou
- 124 Robin Dr
- 2602 E 1800 North Rd
- 2618 E 1800 Rd N
- 2618 E 1800 North Rd
- 2615 E 1800 North Rd
- 2596 E 1800 North Rd
- 2562 E 1800 North Rd
- 2562 E 1800 North Rd
- 2673 E 1800 North Rd
- 1848 N 2525 East Rd
- 1848 N 2525 East Rd
- 1766 N 2680 East Rd
- 1794 N 2525 Rd E
- 1794 N 2525 East Rd
- 1764 N 2525 Rd
- 1788 N 2525 East Rd
- 1786 N 2525 East Rd
- 1764 N 2525 East Rd
- 1764 N 2525 East Rd
- 1784 N 2525 East Rd
- 1784 N 2525 East Rd