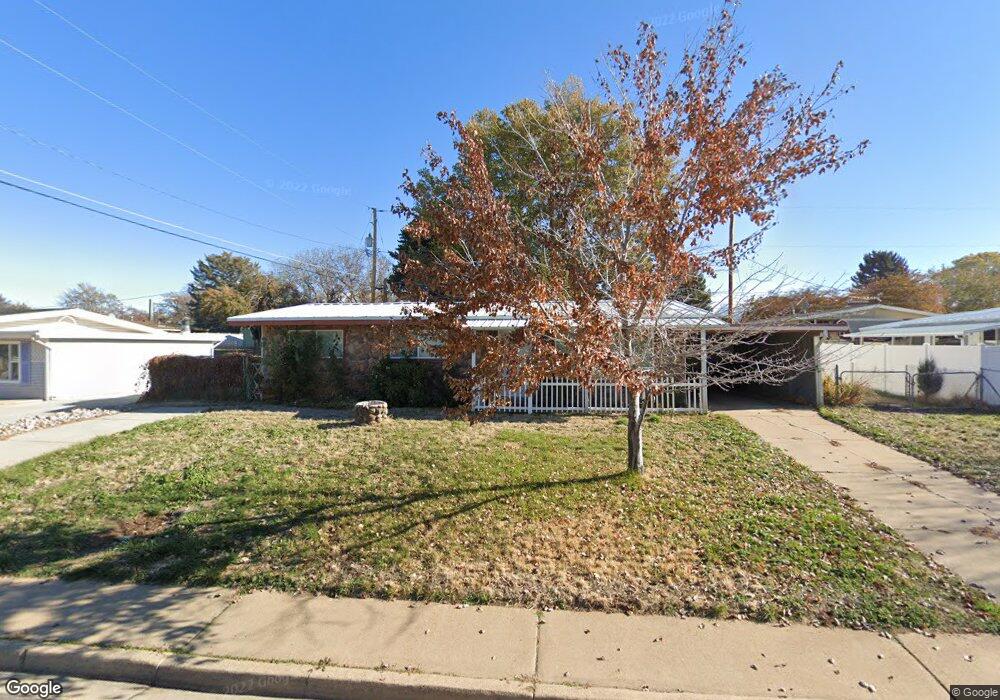
2602 N 425 W Clearfield, UT 84015
Estimated Value: $306,000 - $357,000
3
Beds
1
Bath
1,094
Sq Ft
$307/Sq Ft
Est. Value
About This Home
This home is located at 2602 N 425 W, Clearfield, UT 84015 and is currently estimated at $335,643, approximately $306 per square foot. 2602 N 425 W is a home located in Davis County with nearby schools including Fremont School, Sunset Junior High School, and Northridge High School.
Ownership History
Date
Name
Owned For
Owner Type
Purchase Details
Closed on
Jun 4, 2021
Sold by
Gonzalez Linda J and Estate Of Franklin Marl Reyna
Bought by
Miles Kelly
Current Estimated Value
Home Financials for this Owner
Home Financials are based on the most recent Mortgage that was taken out on this home.
Original Mortgage
$172,500
Outstanding Balance
$155,837
Interest Rate
2.9%
Mortgage Type
New Conventional
Estimated Equity
$179,806
Purchase Details
Closed on
Oct 17, 2018
Sold by
Tait Thomas
Bought by
Reyna Franklin Mark
Home Financials for this Owner
Home Financials are based on the most recent Mortgage that was taken out on this home.
Original Mortgage
$170,910
Interest Rate
4.5%
Mortgage Type
New Conventional
Purchase Details
Closed on
Apr 28, 2005
Sold by
Tait Devaun and Tait Zaila Lee
Bought by
Tait Zaila Lee and Tait Thomas
Create a Home Valuation Report for This Property
The Home Valuation Report is an in-depth analysis detailing your home's value as well as a comparison with similar homes in the area
Home Values in the Area
Average Home Value in this Area
Purchase History
| Date | Buyer | Sale Price | Title Company |
|---|---|---|---|
| Miles Kelly | -- | Stewart Title Ins Age | |
| Reyna Franklin Mark | -- | Mountain View Title & | |
| Tait Zaila Lee | -- | None Available |
Source: Public Records
Mortgage History
| Date | Status | Borrower | Loan Amount |
|---|---|---|---|
| Open | Miles Kelly | $172,500 | |
| Previous Owner | Reyna Franklin Mark | $170,910 |
Source: Public Records
Tax History Compared to Growth
Tax History
| Year | Tax Paid | Tax Assessment Tax Assessment Total Assessment is a certain percentage of the fair market value that is determined by local assessors to be the total taxable value of land and additions on the property. | Land | Improvement |
|---|---|---|---|---|
| 2025 | $3,190 | $291,000 | $132,519 | $158,481 |
| 2024 | $2,970 | $149,049 | $69,677 | $79,372 |
| 2023 | $2,787 | $140,250 | $61,295 | $78,954 |
| 2022 | $2,943 | $265,000 | $116,136 | $148,864 |
| 2021 | $1,406 | $199,000 | $68,064 | $130,936 |
| 2020 | $1,229 | $171,000 | $57,289 | $113,711 |
| 2019 | $1,156 | $165,000 | $74,017 | $90,983 |
| 2018 | $1,024 | $143,000 | $59,151 | $83,849 |
| 2016 | $926 | $66,440 | $27,963 | $38,477 |
| 2015 | $883 | $60,060 | $27,963 | $32,097 |
| 2014 | $865 | $60,117 | $28,159 | $31,958 |
| 2013 | -- | $57,358 | $23,265 | $34,093 |
Source: Public Records
Map
Nearby Homes