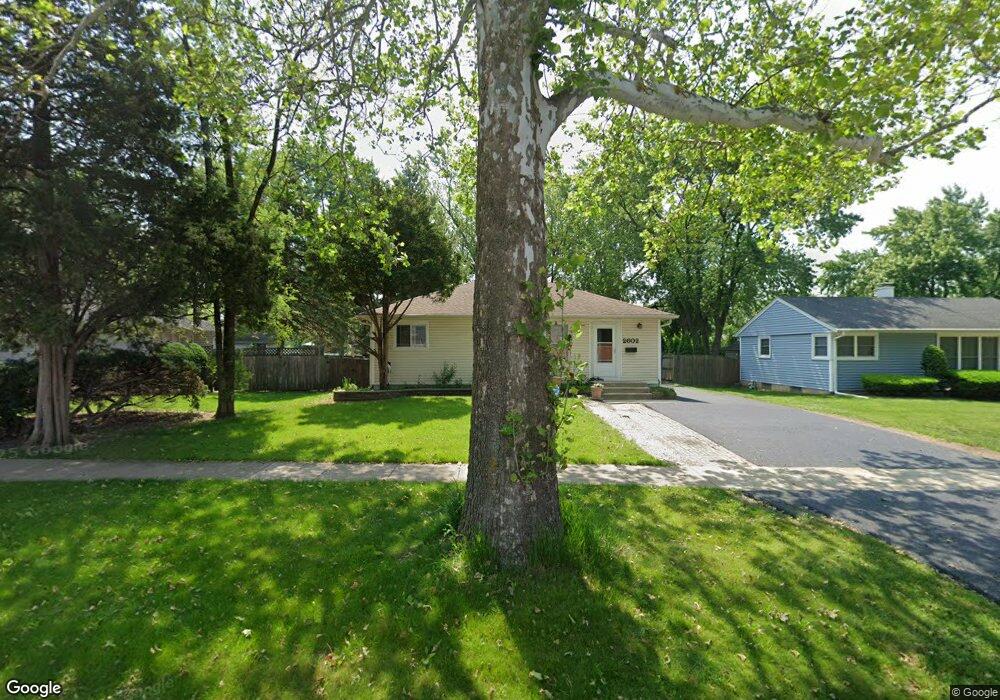
2602 Rohlwing Rd Rolling Meadows, IL 60008
Estimated Value: $307,000 - $323,000
3
Beds
2
Baths
997
Sq Ft
$318/Sq Ft
Est. Value
About This Home
This home is located at 2602 Rohlwing Rd, Rolling Meadows, IL 60008 and is currently estimated at $317,242, approximately $318 per square foot. 2602 Rohlwing Rd is a home located in Cook County with nearby schools including Kimball Hill Elementary School, Carl Sandburg Junior High School, and Rolling Meadows High School.
Ownership History
Date
Name
Owned For
Owner Type
Purchase Details
Closed on
Nov 30, 2009
Sold by
Montesinos Noe and Montesinos Susana
Bought by
Montesinos Susana
Current Estimated Value
Purchase Details
Closed on
Jun 26, 2000
Sold by
Herman Matthew F and Herman Karen D
Bought by
Montesinos Noe and Montesinos Susana
Home Financials for this Owner
Home Financials are based on the most recent Mortgage that was taken out on this home.
Original Mortgage
$135,000
Interest Rate
8.05%
Purchase Details
Closed on
Aug 18, 1997
Sold by
Bechtold Robert C and Bechtold Marsha R
Bought by
Herman Matthew E and Herman Karen D
Home Financials for this Owner
Home Financials are based on the most recent Mortgage that was taken out on this home.
Original Mortgage
$118,800
Interest Rate
7.56%
Create a Home Valuation Report for This Property
The Home Valuation Report is an in-depth analysis detailing your home's value as well as a comparison with similar homes in the area
Home Values in the Area
Average Home Value in this Area
Purchase History
| Date | Buyer | Sale Price | Title Company |
|---|---|---|---|
| Montesinos Susana | -- | None Available | |
| Montesinos Noe | $169,000 | -- | |
| Herman Matthew E | $99,000 | -- |
Source: Public Records
Mortgage History
| Date | Status | Borrower | Loan Amount |
|---|---|---|---|
| Previous Owner | Montesinos Noe | $135,000 | |
| Previous Owner | Herman Matthew E | $118,800 |
Source: Public Records
Tax History
| Year | Tax Paid | Tax Assessment Tax Assessment Total Assessment is a certain percentage of the fair market value that is determined by local assessors to be the total taxable value of land and additions on the property. | Land | Improvement |
|---|---|---|---|---|
| 2025 | $6,952 | $25,000 | $6,540 | $18,460 |
| 2024 | $6,952 | $26,000 | $5,534 | $20,466 |
| 2023 | $6,627 | $26,000 | $5,534 | $20,466 |
| 2022 | $6,627 | $26,000 | $5,534 | $20,466 |
| 2021 | $4,513 | $16,958 | $3,270 | $13,688 |
| 2020 | $4,480 | $16,958 | $3,270 | $13,688 |
| 2019 | $4,515 | $18,948 | $3,270 | $15,678 |
| 2018 | $5,031 | $18,969 | $3,018 | $15,951 |
| 2017 | $4,948 | $18,969 | $3,018 | $15,951 |
| 2016 | $4,869 | $18,969 | $3,018 | $15,951 |
| 2015 | $3,954 | $15,180 | $2,767 | $12,413 |
| 2014 | $4,255 | $16,415 | $2,767 | $13,648 |
| 2013 | $3,572 | $16,415 | $2,767 | $13,648 |
Source: Public Records
Map
Nearby Homes
- 2401 Rohlwing Rd
- 2600 Brookwood Way Dr Unit 316
- 2600 Brookwood Way Dr Unit 305
- 2650 Brookwood Way Dr Unit 313
- 2650 Brookwood Way Dr Unit 108
- 3265 Kirchoff Rd Unit 116
- 3345 Kirchoff Rd Unit 5C
- 304 E Tall Trees Ln
- 3 Holyoke on Auburn
- 3135 Town Square Dr Unit 401
- 3100 Town Square Dr Unit 308
- 3100 Town Square Dr Unit 204
- 2705 Park St
- 3000 California Ave
- 2 Croydon on Duxbury
- 3306 Trillium Cir Unit 3001
- 3209 Trillium Cir
- 4406 Euclid Ave Unit 2C
- 399 Knollwood Ct
- 3200 Thrush Ln
- 2604 Rohlwing Rd
- 3605 Campbell St
- 2606 Rohlwing Rd
- 3603 Campbell St
- 2605 Flicker Ln
- 2608 Rohlwing Rd
- 2603 Flicker Ln
- 2607 Flicker Ln
- 3601 Campbell St
- 2609 Flicker Ln
- 3700 Emerson Ave
- 2603 Rohlwing Rd Unit 1A
- 2603 Rohlwing Rd Unit 1B
- 2603 Rohlwing Rd
- 2610 Rohlwing Rd
- 3702 Emerson Ave
- 3604 Campbell St
- 2612 Rohlwing Rd
- 2611 Flicker Ln
- 2605 Rohlwing Rd Unit 1A
Your Personal Tour Guide
Ask me questions while you tour the home.