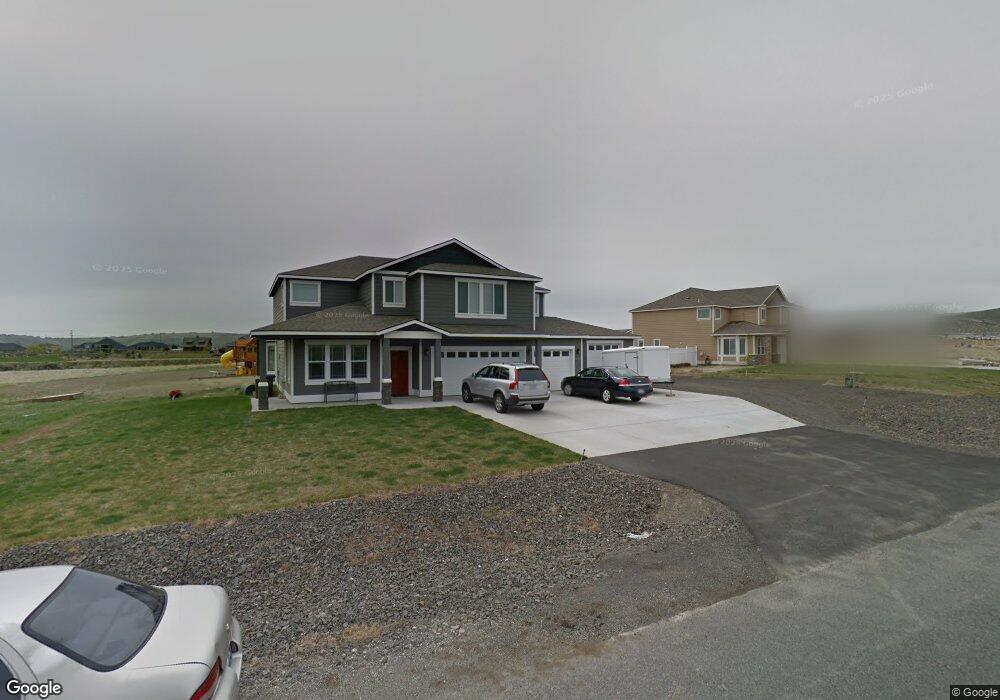
2603 Allison Way Richland, WA 99352
Estimated Value: $739,000 - $982,000
3
Beds
4
Baths
3,139
Sq Ft
$266/Sq Ft
Est. Value
About This Home
This home is located at 2603 Allison Way, Richland, WA 99352 and is currently estimated at $834,510, approximately $265 per square foot. 2603 Allison Way is a home located in Benton County with nearby schools including Cottonwood Elementary School, Desert Hills Middle School, and Kamiakin High School.
Ownership History
Date
Name
Owned For
Owner Type
Purchase Details
Closed on
Nov 16, 2011
Sold by
Varsity Development Llc
Bought by
Murstig Dean E and Murstig Martha E
Current Estimated Value
Home Financials for this Owner
Home Financials are based on the most recent Mortgage that was taken out on this home.
Original Mortgage
$337,318
Interest Rate
3.87%
Mortgage Type
VA
Purchase Details
Closed on
Jun 29, 2011
Sold by
Lawrence J White Investments Llc
Bought by
Varsity Development Llc
Home Financials for this Owner
Home Financials are based on the most recent Mortgage that was taken out on this home.
Original Mortgage
$221,694
Interest Rate
4.55%
Mortgage Type
Construction
Purchase Details
Closed on
Mar 25, 2011
Sold by
Timberland Service Corp
Bought by
Lawrence J White Investments Llc
Home Financials for this Owner
Home Financials are based on the most recent Mortgage that was taken out on this home.
Original Mortgage
$1,537,500
Interest Rate
5.02%
Mortgage Type
Purchase Money Mortgage
Create a Home Valuation Report for This Property
The Home Valuation Report is an in-depth analysis detailing your home's value as well as a comparison with similar homes in the area
Home Values in the Area
Average Home Value in this Area
Purchase History
| Date | Buyer | Sale Price | Title Company |
|---|---|---|---|
| Murstig Dean E | $280,680 | Chicago Title | |
| Varsity Development Llc | $49,854 | Chicago Title | |
| Lawrence J White Investments Llc | $1,762,079 | Chicago Title |
Source: Public Records
Mortgage History
| Date | Status | Borrower | Loan Amount |
|---|---|---|---|
| Previous Owner | Murstig Dean E | $337,318 | |
| Previous Owner | Varsity Development Llc | $221,694 | |
| Previous Owner | Lawrence J White Investments Llc | $1,537,500 |
Source: Public Records
Tax History Compared to Growth
Tax History
| Year | Tax Paid | Tax Assessment Tax Assessment Total Assessment is a certain percentage of the fair market value that is determined by local assessors to be the total taxable value of land and additions on the property. | Land | Improvement |
|---|---|---|---|---|
| 2024 | $6,596 | $794,230 | $160,000 | $634,230 |
| 2023 | $6,596 | $794,230 | $160,000 | $634,230 |
| 2022 | $4,959 | $493,220 | $60,000 | $433,220 |
| 2021 | $4,820 | $493,220 | $60,000 | $433,220 |
| 2020 | $4,886 | $466,140 | $60,000 | $406,140 |
| 2019 | $4,102 | $452,600 | $60,000 | $392,600 |
| 2018 | $4,323 | $384,910 | $60,000 | $324,910 |
| 2017 | $3,896 | $330,760 | $60,000 | $270,760 |
| 2016 | $3,924 | $322,650 | $56,000 | $266,650 |
| 2015 | $3,960 | $322,650 | $56,000 | $266,650 |
| 2014 | -- | $322,650 | $56,000 | $266,650 |
| 2013 | -- | $322,650 | $56,000 | $266,650 |
Source: Public Records
Map
Nearby Homes
- 3791 Morningside Pkwy
- 3646 Morningside Pkwy
- 3721 Morningside Pkwy
- 3735 Morningside Pkwy
- 3682 Morningside Pkwy
- 2842 Sumac Ave
- 3725 Nuthatch St
- 3629 Allison Way Lot 172
- 2922 Savanna Ave Lot 278
- NKA Whitesage Ave Lot 273
- 3425 Nuthatch Street Lot 261
- 3378 Allison Way Lot 256
- 3000 Meadowlark Ave Lot 246
- 2992 Meadowlark Ave Lot 245
- 2904 Meadowlark Ave Lot 234
- 2937 Whitesage Avenue Lot 272
- 2961 Whitesage Avenue Lot 270
- 2973 Whitesage Avenue Lot 269
- 2985 Whitesage Avenue Lot 268
- 2997 Whitesage Avenue Lot 267
- 2603 Allison Way
- 2625 Allison Way
- 2561 Allison Way
- 2561 Allison Way Unit BRAND NEW LANDMARK H
- 2625 Allison Way
- NKA Allison Way
- 2562 Allison Way
- 2549 Allison Way
- 2997 Karlee Dr
- 2997 Karlee Dr
- 2998 Karlee Dr
- 2689 Allison Way
- 2689 Allison Way Unit LESS THAN 1 Yr Old o
- 2998 Karlee Dr
- 2998 Karlee Dr Unit Highly Updated Rambl
- 2548 Allison Way
- 2704 Allison Way
- 2487 Allison Way
- 2487 Allison Way Unit Super Home on .54 ac
- 2985 Karlee Dr