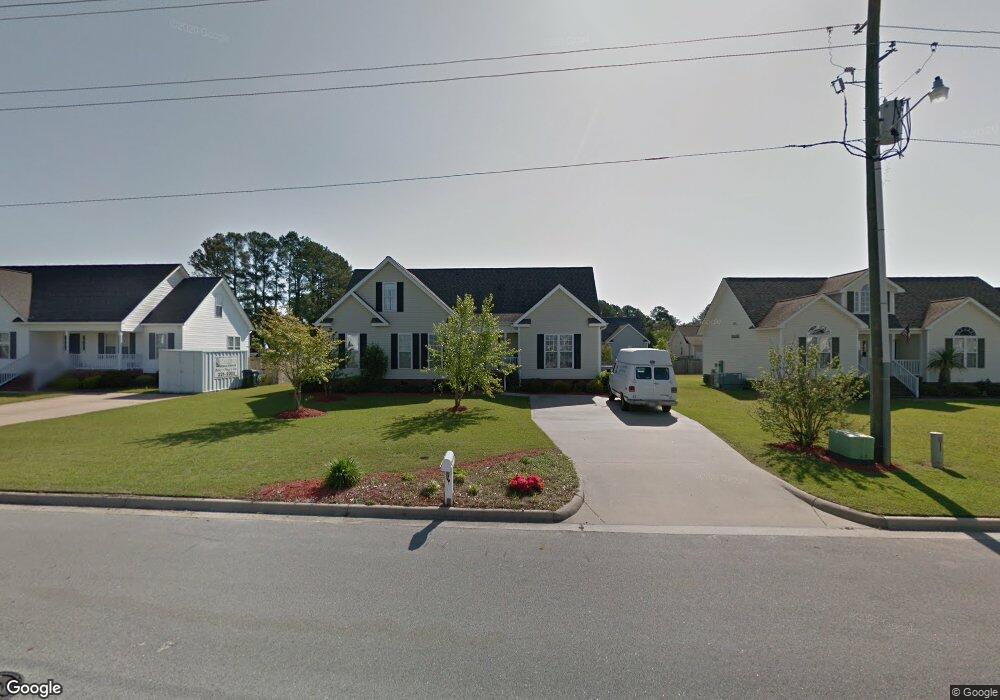
2603 Forbes Ave Winterville, NC 28590
Estimated Value: $291,000 - $305,000
4
Beds
3
Baths
2,024
Sq Ft
$148/Sq Ft
Est. Value
About This Home
This home is located at 2603 Forbes Ave, Winterville, NC 28590 and is currently estimated at $300,371, approximately $148 per square foot. 2603 Forbes Ave is a home located in Pitt County with nearby schools including W.H. Robinson Elementary School, A.G. Cox Middle School, and South Central High School.
Create a Home Valuation Report for This Property
The Home Valuation Report is an in-depth analysis detailing your home's value as well as a comparison with similar homes in the area
Home Values in the Area
Average Home Value in this Area
Tax History Compared to Growth
Tax History
| Year | Tax Paid | Tax Assessment Tax Assessment Total Assessment is a certain percentage of the fair market value that is determined by local assessors to be the total taxable value of land and additions on the property. | Land | Improvement |
|---|---|---|---|---|
| 2025 | $1,859 | $274,009 | $40,000 | $234,009 |
| 2024 | $1,847 | $274,009 | $40,000 | $234,009 |
| 2023 | $1,418 | $175,416 | $26,500 | $148,916 |
| 2022 | $1,424 | $175,416 | $26,500 | $148,916 |
| 2021 | $1,418 | $175,416 | $26,500 | $148,916 |
| 2020 | $1,427 | $175,416 | $26,500 | $148,916 |
| 2019 | $1,371 | $166,881 | $26,500 | $140,381 |
| 2018 | $1,309 | $166,881 | $26,500 | $140,381 |
| 2017 | $1,309 | $166,881 | $26,500 | $140,381 |
| 2016 | $1,273 | $164,140 | $26,500 | $137,640 |
| 2015 | $1,303 | $169,711 | $26,000 | $143,711 |
| 2014 | $1,303 | $169,711 | $26,000 | $143,711 |
Source: Public Records
Map
Nearby Homes
- 433 Drexel Ln
- 272 Primrose Ln
- 483 Primrose Ln
- 2520 Ange St
- 334 Gayle Blvd
- 312 Brogden Ct
- 2537 Jones St
- 2523 Jones St
- 2531 Jones St
- 603 Brookfield Dr
- 613 Brookfield Dr
- 227 Hammond St
- 623 Norberry Dr
- 263 Laurie Ellis Rd
- 2458 Jones St
- 2414 Glenda St
- 2335 Wedgewood Dr
- 2841 Verbena Way
- 561 Channel Dr
- 626 Winterfield Dr
- 2597 Forbes Ave
- 2613 Forbes Ave
- 2606 Coopers Point Dr
- 2604 Coopers Point Dr
- 2604 Coopers Pointe Dr
- 2617 Forbes Ave
- 2591 Forbes Ave
- 2610 Coopers Point Dr
- 414 Selby Ct
- 415 Selby Ct
- 2602 Coopers Point Dr
- 400 Cooper St
- 2616 Coopers Point Dr
- 2585 Forbes Ave
- 394 Cooper St
- 363 Primrose Ln
- 371 Primrose Ln
- 347 Primrose Ln
- 372 Cooper St
- 408 Selby Ct