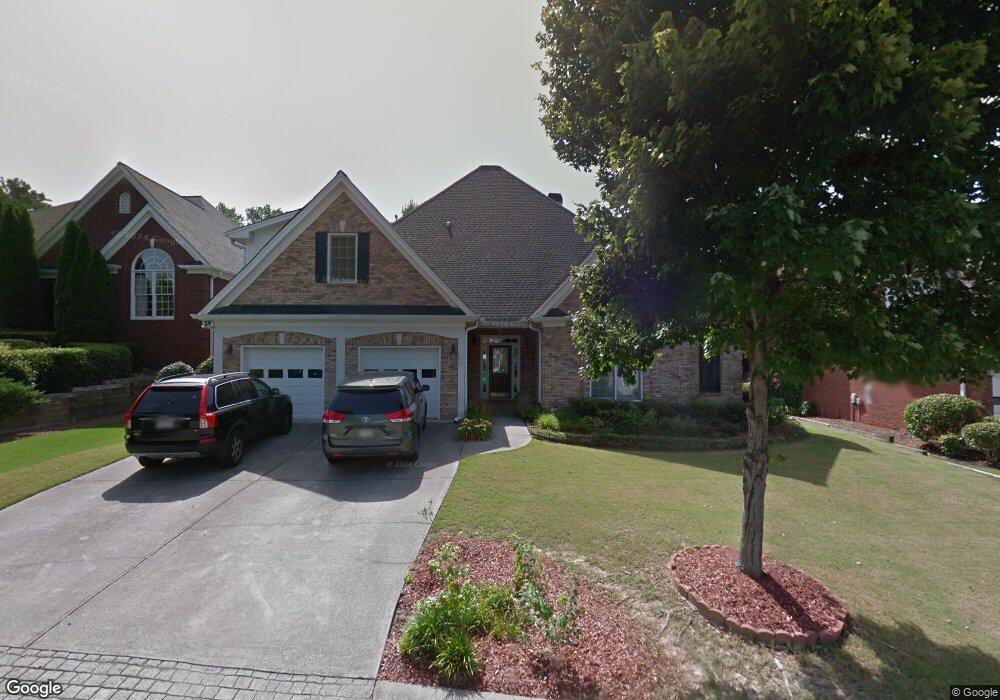
2603 Harman Park Cir Unit 2 Duluth, GA 30097
Estimated Value: $655,000 - $774,000
3
Beds
3
Baths
2,984
Sq Ft
$234/Sq Ft
Est. Value
About This Home
This home is located at 2603 Harman Park Cir Unit 2, Duluth, GA 30097 and is currently estimated at $699,271, approximately $234 per square foot. 2603 Harman Park Cir Unit 2 is a home located in Gwinnett County with nearby schools including M. H. Mason Elementary School, Hull Middle School, and Peachtree Ridge High School.
Ownership History
Date
Name
Owned For
Owner Type
Purchase Details
Closed on
Dec 17, 2019
Sold by
Lee Song D
Bought by
Kim Jong M and Lee Song D
Current Estimated Value
Purchase Details
Closed on
Jun 27, 2013
Sold by
Kim Jong M
Bought by
Lee Song D
Purchase Details
Closed on
Apr 26, 2002
Sold by
Kim Song D
Bought by
Kim Song D and Kim Yun T
Home Financials for this Owner
Home Financials are based on the most recent Mortgage that was taken out on this home.
Original Mortgage
$252,000
Interest Rate
7.18%
Mortgage Type
New Conventional
Purchase Details
Closed on
May 31, 2000
Sold by
Sugarloaf Park Builders Llc
Bought by
Farkas Cathy A and Farkas Charles J
Home Financials for this Owner
Home Financials are based on the most recent Mortgage that was taken out on this home.
Original Mortgage
$227,550
Interest Rate
7.8%
Mortgage Type
New Conventional
Create a Home Valuation Report for This Property
The Home Valuation Report is an in-depth analysis detailing your home's value as well as a comparison with similar homes in the area
Home Values in the Area
Average Home Value in this Area
Purchase History
| Date | Buyer | Sale Price | Title Company |
|---|---|---|---|
| Kim Jong M | -- | -- | |
| Lee Song D | -- | -- | |
| Kim Song D | -- | -- | |
| Kim Song D | $315,000 | -- | |
| Farkas Cathy A | $284,500 | -- |
Source: Public Records
Mortgage History
| Date | Status | Borrower | Loan Amount |
|---|---|---|---|
| Previous Owner | Kim Song D | $252,000 | |
| Previous Owner | Farkas Cathy A | $227,550 |
Source: Public Records
Tax History Compared to Growth
Tax History
| Year | Tax Paid | Tax Assessment Tax Assessment Total Assessment is a certain percentage of the fair market value that is determined by local assessors to be the total taxable value of land and additions on the property. | Land | Improvement |
|---|---|---|---|---|
| 2025 | $2,209 | $271,920 | $48,240 | $223,680 |
| 2024 | $2,208 | $238,120 | $54,000 | $184,120 |
| 2023 | $2,208 | $230,520 | $38,000 | $192,520 |
| 2022 | $2,169 | $211,080 | $38,000 | $173,080 |
| 2021 | $5,483 | $157,080 | $36,000 | $121,080 |
| 2020 | $5,279 | $145,920 | $32,000 | $113,920 |
| 2019 | $5,099 | $145,920 | $32,000 | $113,920 |
| 2018 | $4,884 | $135,560 | $28,000 | $107,560 |
| 2016 | $4,902 | $135,560 | $28,000 | $107,560 |
| 2015 | $4,175 | $112,960 | $23,600 | $89,360 |
| 2014 | -- | $110,160 | $23,600 | $86,560 |
Source: Public Records
Map
Nearby Homes
- 2502 Oak Hill Overlook
- 2747 Mount Pleasant Trail
- 2491 Cannon Farm Ln
- 2437 Staunton Dr
- 2568 Gadsen Walk
- 2515 Gadsen Walk
- 2646 Ridge Run Trail
- 2539 Larson Creek Cove
- 2061 Meadow Peak Rd
- 2207 Landing Walk Dr
- 2199 Landing Walk Dr
- 2201 Landing Walk Dr
- 2098 Meadow Peak Rd
- 2139 Meadow Peak Rd
- 2816 Staunton Dr
- 2578 Worrall Hill Way
- 2918 Major Ridge Trail
- 2893 Thurleston Ln
- 2883 Thurleston Ln
- 3987 Knox Park Overlook
- 2613 Harman Park Cir Unit 2
- 2593 Harman Park Cir
- 2468 Shenley Park Ct
- 2478 Shenley Park Ct
- 2245 Hyde Park Way
- 2235 Hyde Park Way Unit 2
- 2623 Harman Park Cir
- 2604 Harman Park Cir NW
- 2604 Harman Park Cir
- 2225 Hyde Park Way Unit 2
- 2594 Harman Park Cir
- 2594 Harman Park Cir Unit 93
- 2614 Harman Park Cir
- 2584 Harman Park Cir
- 2633 Harman Park Cir Unit 2
- 2487 Shenley Park Ct Unit 1
- 2458 Shenley Park Ct
- 2574 Harman Park Cir
- 2624 Harman Park Cir
- 2634 Harman Park Cir Unit 2