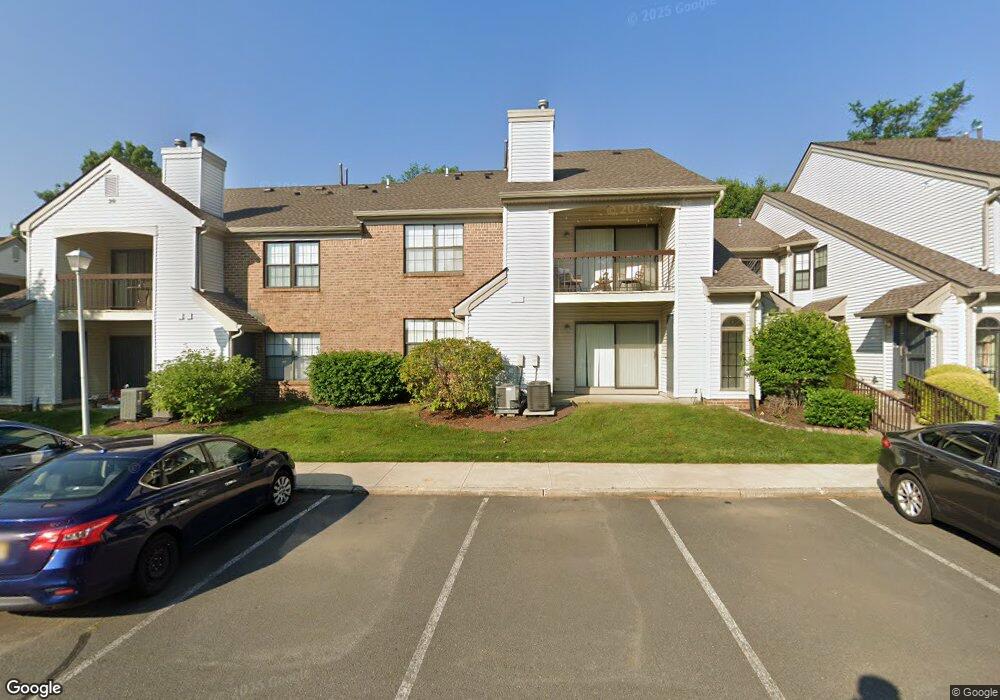
2603 Lighthouse Ln Parlin, NJ 08859
Estimated Value: $283,969 - $343,000
1
Bed
1
Bath
899
Sq Ft
$354/Sq Ft
Est. Value
About This Home
This home is located at 2603 Lighthouse Ln, Parlin, NJ 08859 and is currently estimated at $317,990, approximately $353 per square foot. 2603 Lighthouse Ln is a home located in Middlesex County with nearby schools including Sayreville War Memorial High School, St. Mary Elementary School, and New Road School of Parlin.
Ownership History
Date
Name
Owned For
Owner Type
Purchase Details
Closed on
Dec 14, 2012
Sold by
Rispoli Agnostino
Bought by
Rispoli Tony G
Current Estimated Value
Home Financials for this Owner
Home Financials are based on the most recent Mortgage that was taken out on this home.
Original Mortgage
$115,500
Interest Rate
3.43%
Mortgage Type
New Conventional
Purchase Details
Closed on
Aug 3, 2011
Sold by
Rooney Eileen
Bought by
Rispoli Tony G and Rispoli Agnostino
Home Financials for this Owner
Home Financials are based on the most recent Mortgage that was taken out on this home.
Original Mortgage
$117,600
Interest Rate
4.09%
Mortgage Type
New Conventional
Purchase Details
Closed on
Jan 27, 2004
Sold by
Lane Dorothy A
Bought by
Rooney Eileen A
Home Financials for this Owner
Home Financials are based on the most recent Mortgage that was taken out on this home.
Original Mortgage
$128,000
Interest Rate
5.67%
Create a Home Valuation Report for This Property
The Home Valuation Report is an in-depth analysis detailing your home's value as well as a comparison with similar homes in the area
Home Values in the Area
Average Home Value in this Area
Purchase History
| Date | Buyer | Sale Price | Title Company |
|---|---|---|---|
| Rispoli Tony G | -- | Westcor Land Title Ins Co | |
| Rispoli Tony G | $147,000 | Commonwealth Land Title Insu | |
| Rooney Eileen A | $161,000 | -- |
Source: Public Records
Mortgage History
| Date | Status | Borrower | Loan Amount |
|---|---|---|---|
| Previous Owner | Rispoli Tony G | $115,500 | |
| Previous Owner | Rispoli Tony G | $117,600 | |
| Previous Owner | Rooney Eileen A | $128,000 |
Source: Public Records
Tax History Compared to Growth
Tax History
| Year | Tax Paid | Tax Assessment Tax Assessment Total Assessment is a certain percentage of the fair market value that is determined by local assessors to be the total taxable value of land and additions on the property. | Land | Improvement |
|---|---|---|---|---|
| 2025 | -- | $66,900 | $27,500 | $39,400 |
| 2024 | -- | $66,900 | $27,500 | $39,400 |
| 2023 | $3,460 | $66,900 | $27,500 | $39,400 |
| 2022 | $3,460 | $66,900 | $27,500 | $39,400 |
| 2021 | $3,419 | $66,900 | $27,500 | $39,400 |
| 2020 | $3,326 | $66,900 | $27,500 | $39,400 |
| 2019 | $3,251 | $66,900 | $27,500 | $39,400 |
| 2018 | $3,188 | $66,900 | $27,500 | $39,400 |
| 2017 | $3,108 | $66,900 | $27,500 | $39,400 |
| 2016 | $3,269 | $66,900 | $27,500 | $39,400 |
| 2015 | $2,944 | $66,900 | $27,500 | $39,400 |
| 2014 | $2,859 | $66,900 | $27,500 | $39,400 |
Source: Public Records
Map
Nearby Homes
- 1904 Bayhead Dr
- 3014 Lighthouse Ln
- 3015 Lighthouse Ln
- 1202 Harbor Club Dr
- 1511 Pebble Place
- 67 Grabowski Dr
- 1200 Ernston Rd
- 21 Gordon Ave
- 37 Hoffman Ave
- 47 Prusakowski Blvd
- 10 Dolan Ave
- 39 Rojewski Way
- 2505 Ridgeview Ct
- 4 Prusakowski Blvd
- 60 Wlodarczyk Place
- 121 Giera Ct
- 179 Gabriel Terrace
- 6405 Fernandez Ct
- 109 Giera Ct Unit 74
- 21 Luke St
- 2602 Lighthouse Ln Unit 2602
- 2604 Lighthouse Ln
- 2611 Lighthouse Ln Unit 2611
- 2612 Lighthouse Ln
- 2605 Lighthouse Ln
- 2601 Lighthouse Ln
- 2613 Lighthouse Ln
- 2609 Lighthouse Ln
- 2609 Lighthouse Ln Unit 2609
- 2606 Lighthouse Ln
- 2614 Lighthouse Ln
- 2607 Lighthouse Ln
- 2615 Lighthouse Ln
- 2703 Lighthouse Ln
- 2704 Lighthouse Ln
- 2704 Lighthouse Ln
- 2704 Lighthouse Ln Unit 2704
- 2704 Lighthouse Ln
- 2702 Lighthouse Ln
- 2311 Bayhead Dr Unit 2311