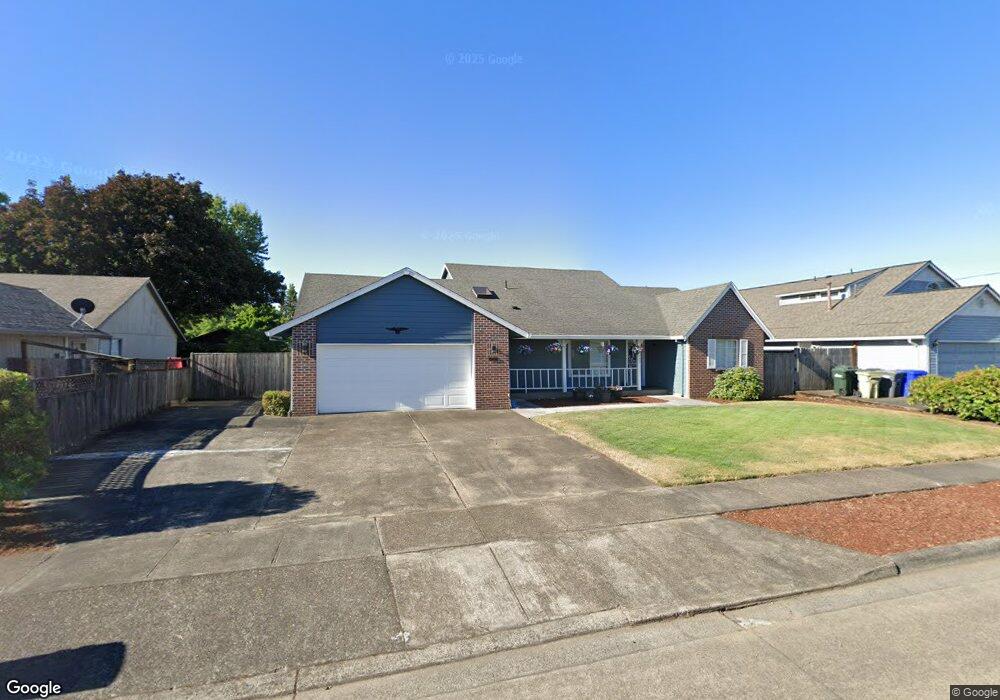
2603 S Dogwood St Cornelius, OR 97113
Estimated Value: $587,462 - $634,000
3
Beds
3
Baths
1,935
Sq Ft
$316/Sq Ft
Est. Value
About This Home
This home is located at 2603 S Dogwood St, Cornelius, OR 97113 and is currently estimated at $612,116, approximately $316 per square foot. 2603 S Dogwood St is a home located in Washington County with nearby schools including Free Orchards Elementary School, Evergreen Jr High School, and Glencoe High School.
Ownership History
Date
Name
Owned For
Owner Type
Purchase Details
Closed on
Jan 14, 2021
Sold by
Johnson Carla and Johnson Ken
Bought by
Johnson Carla and Johnson Ken
Current Estimated Value
Home Financials for this Owner
Home Financials are based on the most recent Mortgage that was taken out on this home.
Original Mortgage
$615,000
Outstanding Balance
$599,133
Interest Rate
2.1%
Mortgage Type
Reverse Mortgage Home Equity Conversion Mortgage
Estimated Equity
$12,983
Purchase Details
Closed on
Mar 13, 2012
Sold by
Schafer David
Bought by
Johnson Kenneth and Johnson Carla
Home Financials for this Owner
Home Financials are based on the most recent Mortgage that was taken out on this home.
Original Mortgage
$307,500
Interest Rate
3.83%
Mortgage Type
Reverse Mortgage Home Equity Conversion Mortgage
Purchase Details
Closed on
May 26, 2006
Sold by
Simantel Frances D
Bought by
Simantel Frances D and Frances D Simantel Revocable Living Tr
Create a Home Valuation Report for This Property
The Home Valuation Report is an in-depth analysis detailing your home's value as well as a comparison with similar homes in the area
Home Values in the Area
Average Home Value in this Area
Purchase History
| Date | Buyer | Sale Price | Title Company |
|---|---|---|---|
| Johnson Carla | -- | Old Republic Title Co Of Or | |
| Johnson Kenneth | $205,000 | First American | |
| Simantel Frances D | -- | None Available |
Source: Public Records
Mortgage History
| Date | Status | Borrower | Loan Amount |
|---|---|---|---|
| Open | Johnson Carla | $615,000 | |
| Closed | Johnson Kenneth | $307,500 |
Source: Public Records
Tax History Compared to Growth
Tax History
| Year | Tax Paid | Tax Assessment Tax Assessment Total Assessment is a certain percentage of the fair market value that is determined by local assessors to be the total taxable value of land and additions on the property. | Land | Improvement |
|---|---|---|---|---|
| 2025 | $5,259 | $320,640 | -- | -- |
| 2024 | $4,815 | $311,310 | -- | -- |
| 2023 | $4,815 | $302,250 | $0 | $0 |
| 2022 | $4,685 | $302,250 | $0 | $0 |
| 2021 | $4,594 | $284,910 | $0 | $0 |
| 2020 | $4,497 | $276,620 | $0 | $0 |
| 2019 | $4,368 | $268,570 | $0 | $0 |
| 2018 | $4,177 | $260,750 | $0 | $0 |
| 2017 | $4,024 | $253,160 | $0 | $0 |
| 2016 | $3,914 | $245,790 | $0 | $0 |
| 2015 | $3,754 | $238,640 | $0 | $0 |
| 2014 | $3,339 | $219,180 | $0 | $0 |
Source: Public Records
Map
Nearby Homes
- 2736 S Ivy St Unit LT838
- 2772 S Ivy St Unit LT840
- 2778 S Ivy St Unit Lot 841
- 2786 S Ivy St Unit Lot 842
- 2935 S Ginger St
- 802 S 25th Ave
- 169 S 25th Ave
- 153 S 26th Ave
- 857 S 25th Ave
- 2478 S Alpine St
- 3020 S Kodiak St Unit LT811
- 3109 S Jasper Dr
- 3080 S Kodiak St Unit LT813
- 2095 S Heather St
- 3147 S Kodiak St Unit LT798
- 1266 S 22nd Ave
- 3206 S Kodiak St Unit LT822
- The 2278 Plan at Laurel Woods
- The 2890 Plan at Laurel Woods
- The 2038 Plan at Laurel Woods
- 2601 S Dogwood St
- 2605 S Dogwood St
- 2607 S Dogwood St
- 2602 S Dogwood St
- 2604 S Dogwood St
- 2600 S Dogwood St
- 2606 S Dogwood St
- 2575 S Dogwood St
- 2609 S Dogwood St
- 2598 S Ginger St
- 2588 S Dogwood St
- 440 S 26th Ave
- 453 S 27th Ave
- 2700 S Dogwood St
- 2557 S Dogwood St
- 2701 S Dogwood St
- 2582 S Ginger St
- 2595 S Ginger St Unit 2-2G
- 457 S 26th Ave
- 2558 S Dogwood St