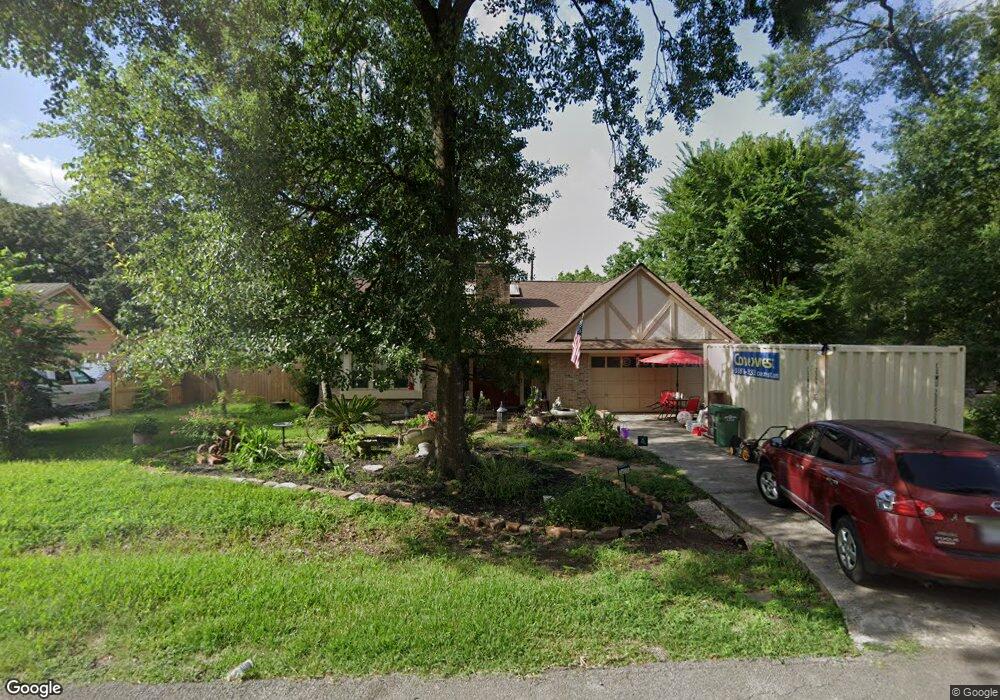
26035 Leafywood Dr Spring, TX 77386
Estimated Value: $271,760 - $300,000
Studio
2
Baths
1,816
Sq Ft
$157/Sq Ft
Est. Value
About This Home
This home is located at 26035 Leafywood Dr, Spring, TX 77386 and is currently estimated at $284,440, approximately $156 per square foot. 26035 Leafywood Dr is a home located in Montgomery County with nearby schools including Oak Ridge Elementary School, Vogel Intermediate School, and Irons J High School.
Ownership History
Date
Name
Owned For
Owner Type
Purchase Details
Closed on
Mar 16, 2016
Sold by
Parsons Ramona M
Bought by
Parsons Gina L
Current Estimated Value
Purchase Details
Closed on
Sep 29, 1999
Sold by
Jones Wanda
Bought by
Parson Ramona M
Purchase Details
Closed on
Jul 25, 1997
Sold by
Stoecker Corp
Bought by
Jones Wanda L
Purchase Details
Closed on
Sep 16, 1996
Sold by
Craig Margaret S
Bought by
Jones Wanda
Home Financials for this Owner
Home Financials are based on the most recent Mortgage that was taken out on this home.
Original Mortgage
$79,000
Interest Rate
8.24%
Mortgage Type
Seller Take Back
Purchase Details
Closed on
Jan 1, 1990
Sold by
Williamsburgh Savings B
Bought by
Parsons Gina L
Purchase Details
Closed on
Jan 1, 1984
Bought by
Parsons Gina L
Create a Home Valuation Report for This Property
The Home Valuation Report is an in-depth analysis detailing your home's value as well as a comparison with similar homes in the area
Purchase History
| Date | Buyer | Sale Price | Title Company |
|---|---|---|---|
| Parsons Gina L | -- | -- | |
| Parson Ramona M | -- | -- | |
| Jones Wanda L | -- | Montgomery County Title Co | |
| Jones Wanda | -- | Stewart Title | |
| Parsons Gina L | -- | -- | |
| Parsons Gina L | -- | -- |
Source: Public Records
Mortgage History
| Date | Status | Borrower | Loan Amount |
|---|---|---|---|
| Previous Owner | Jones Wanda | $79,000 |
Source: Public Records
Tax History
| Year | Tax Paid | Tax Assessment Tax Assessment Total Assessment is a certain percentage of the fair market value that is determined by local assessors to be the total taxable value of land and additions on the property. | Land | Improvement |
|---|---|---|---|---|
| 2025 | $941 | $233,485 | $58,000 | $175,485 |
| 2024 | $849 | $225,126 | -- | -- |
| 2023 | $849 | $204,660 | $58,000 | $188,330 |
| 2022 | $3,526 | $186,050 | $58,000 | $174,340 |
| 2021 | $3,398 | $169,140 | $8,060 | $161,080 |
| 2020 | $3,416 | $162,330 | $8,060 | $154,270 |
| 2019 | $3,492 | $160,600 | $8,060 | $153,910 |
| 2018 | $1,925 | $146,000 | $8,060 | $137,940 |
| 2017 | $3,419 | $157,000 | $8,060 | $148,940 |
| 2016 | $3,281 | $150,690 | $8,060 | $148,940 |
| 2015 | $670 | $136,990 | $8,060 | $138,240 |
| 2014 | $670 | $124,540 | $8,060 | $122,020 |
Source: Public Records
Map
Nearby Homes
- 25910 Maplewood Dr
- 26206 Maplewood Dr
- 127 Sagewood Dr
- 235 Basswood Dr
- 119 Heatherwood Dr
- 410 Gamewood Dr
- 210 Basswood Dr
- 202 Basswood Dr
- 26311 Maplewood Dr
- 25607 Spring Ridge Dr
- 25657 Interstate 45
- 26307 Hillside Dr
- 186 Spring Pines Dr
- 506 Glenwood Ridge Dr
- 427 Pinewood Ridge Dr
- 26410 Maplewood Dr
- 515 Spindle Ridge Dr
- 426 Nursery Rd
- 424 Nursery Rd
- 26522 Hillside Dr
- 26031 Leafywood Dr
- 26002 Woodglen Dr
- 26007 Woodglen Dr
- 26027 Leafywood Dr
- 26034 Leafywood Dr
- 25914 Woodglen Dr
- 403 Presswood Dr
- 26030 Leafywood Dr
- 26015 Woodglen Dr
- 25915 Woodglen Dr
- 26011 Woodglen Dr
- 26026 Leafywood Dr
- 26023 Leafywood Dr
- 25910 Woodglen Dr
- 407 Presswood Dr
- 25911 Woodglen Dr
- 402 Presswood Dr
- 26010 Maplewood Dr
- 26022 Leafywood Dr
- 26006 Maplewood Dr
Your Personal Tour Guide
Ask me questions while you tour the home.