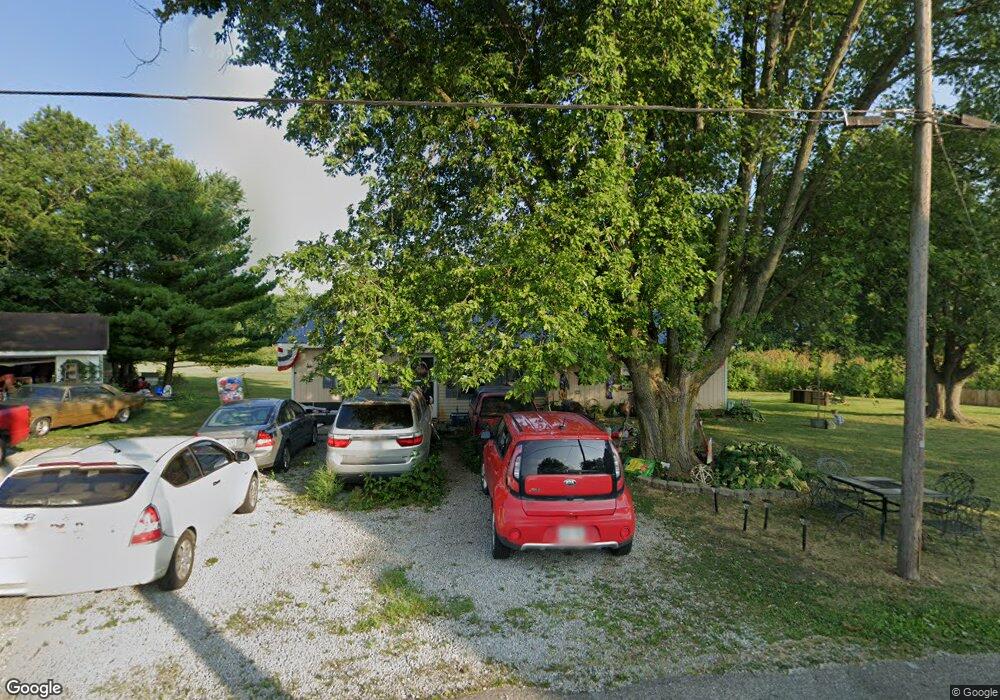
26035 Locust Grove Rd New Holland, OH 43145
Estimated Value: $184,210 - $224,000
3
Beds
1
Bath
1,536
Sq Ft
$130/Sq Ft
Est. Value
About This Home
This home is located at 26035 Locust Grove Rd, New Holland, OH 43145 and is currently estimated at $199,803, approximately $130 per square foot. 26035 Locust Grove Rd is a home located in Pickaway County with nearby schools including Westfall Elementary School, Westfall Middle School, and Westfall High School.
Ownership History
Date
Name
Owned For
Owner Type
Purchase Details
Closed on
May 18, 2021
Sold by
Davis Donald L
Bought by
Davis Donald L and Davis Wilma J
Current Estimated Value
Purchase Details
Closed on
Jun 4, 2009
Sold by
Fannie Mae
Bought by
Davis Donald L
Purchase Details
Closed on
Nov 7, 2008
Sold by
Redding Clark R
Bought by
Federal National Mortgage Association
Purchase Details
Closed on
Oct 2, 2002
Sold by
Citifinancial Mtg Co Inc
Bought by
Redding Clark R
Home Financials for this Owner
Home Financials are based on the most recent Mortgage that was taken out on this home.
Original Mortgage
$63,000
Interest Rate
6.39%
Mortgage Type
New Conventional
Purchase Details
Closed on
Jun 13, 2002
Sold by
Shrf Vern Roberts Iii Pr
Bought by
Citifinancial Mtg Co Inc
Create a Home Valuation Report for This Property
The Home Valuation Report is an in-depth analysis detailing your home's value as well as a comparison with similar homes in the area
Home Values in the Area
Average Home Value in this Area
Purchase History
| Date | Buyer | Sale Price | Title Company |
|---|---|---|---|
| Davis Donald L | -- | None Available | |
| Davis Donald L | $35,000 | Arrow Title | |
| Federal National Mortgage Association | $43,334 | None Available | |
| Redding Clark R | $63,000 | -- | |
| Citifinancial Mtg Co Inc | $40,000 | -- |
Source: Public Records
Mortgage History
| Date | Status | Borrower | Loan Amount |
|---|---|---|---|
| Previous Owner | Redding Clark R | $63,000 |
Source: Public Records
Tax History Compared to Growth
Tax History
| Year | Tax Paid | Tax Assessment Tax Assessment Total Assessment is a certain percentage of the fair market value that is determined by local assessors to be the total taxable value of land and additions on the property. | Land | Improvement |
|---|---|---|---|---|
| 2024 | -- | $46,780 | $16,630 | $30,150 |
| 2023 | $1,623 | $46,780 | $16,630 | $30,150 |
| 2022 | $1,473 | $37,170 | $13,350 | $23,820 |
| 2021 | $1,485 | $37,170 | $13,350 | $23,820 |
| 2020 | $1,488 | $37,170 | $13,350 | $23,820 |
| 2019 | $1,141 | $31,170 | $12,300 | $18,870 |
| 2018 | $1,215 | $31,170 | $12,300 | $18,870 |
| 2017 | $1,733 | $31,170 | $12,300 | $18,870 |
| 2016 | $1,046 | $27,880 | $11,010 | $16,870 |
| 2015 | $1,068 | $27,880 | $11,010 | $16,870 |
| 2014 | $1,082 | $27,880 | $11,010 | $16,870 |
| 2013 | $1,194 | $29,080 | $10,770 | $18,310 |
Source: Public Records
Map
Nearby Homes
- 13525 Clarksburg Pike
- 207 U S 22
- 0 Beaumont Ct
- 25 W Front St
- 36 Circle Ave
- 0 Us Highway 22 and 3 Unit Lot 3 224024058
- 0 Us Highway 22 and 3 Unit Lot 2 224024055
- 0 Us Highway 22 and 3 Unit Lot 1 224024051
- 514 Yates St
- 518 Yates St
- 8 Allen Ave
- 198 Stinson Dr
- 17310 High St
- 25805 Chillicothe Pike
- 21651 Hannawalt Rd
- 11744 Yankeetown Pike
- 0 Yankeetown Pike Unit 225019293
- 2922 SE Good Hope New Holland Rd SE
- 3508 Knight Rd NE
- 7882 Glaze Rd Unit NE
- 26065 Locust Grove Rd
- 26054 Locust Grove Rd
- 26005 Locust Grove Rd
- 26075 Locust Grove Rd
- 26066 Locust Grove Rd
- 26066 Locust Grove Rd Unit 100
- 26066 Locust Grove Rd
- 25975 State Route 207
- 26076 Locust Grove Rd
- 25988 State Route 207
- 25978 State Route 207
- 25965 State Route 207
- 26095 Locust Grove Rd
- 26100 Locust Grove Rd
- 26105 Locust Grove Rd
- 26090 Locust Grove Rd
- 25971 Locust Grove Rd
- 26098 Poplar Alley
- 25970 State Route 207
- 26115 Locust Grove Rd