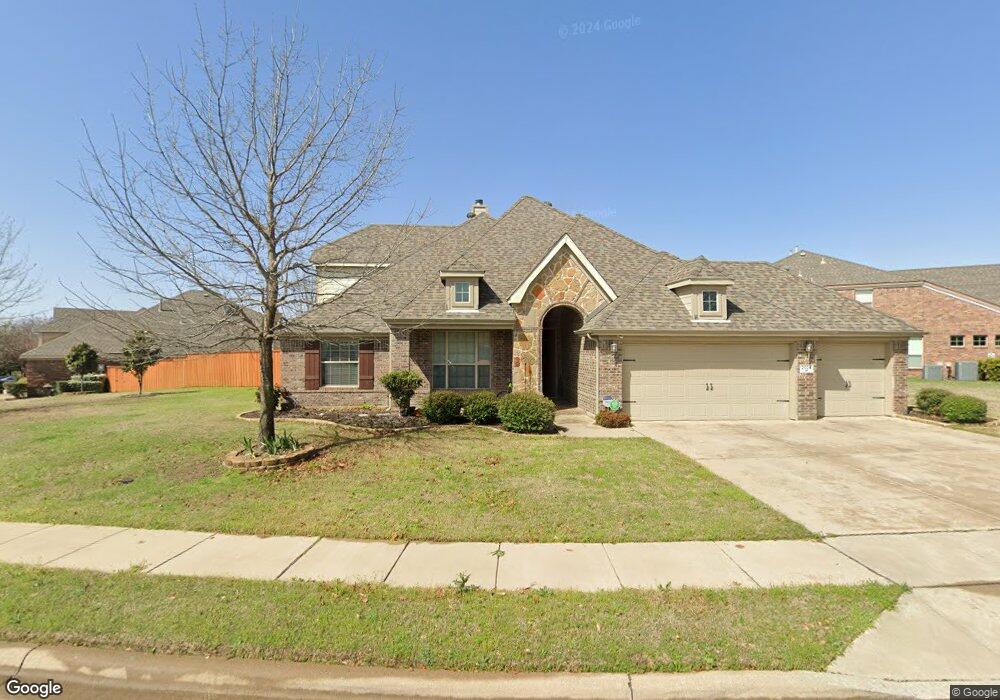
2604 Cotillion Dr Sachse, TX 75048
Estimated Value: $510,042 - $563,000
3
Beds
3
Baths
2,843
Sq Ft
$190/Sq Ft
Est. Value
About This Home
This home is located at 2604 Cotillion Dr, Sachse, TX 75048 and is currently estimated at $539,261, approximately $189 per square foot. 2604 Cotillion Dr is a home located in Dallas County with nearby schools including Firewheel Christian Academy, Pinnacle Montessori of Sachse, and Oakhill Day School.
Ownership History
Date
Name
Owned For
Owner Type
Purchase Details
Closed on
Jan 13, 2023
Sold by
Nguyen Cao T and Nguyen Thao
Bought by
Nguyen Cao T and Ta Thao
Current Estimated Value
Purchase Details
Closed on
Oct 21, 2016
Sold by
Jackson Stephen Taylor and Jackson Krystle Diane
Bought by
Nguyen Trang and Nguyen Andrew
Home Financials for this Owner
Home Financials are based on the most recent Mortgage that was taken out on this home.
Original Mortgage
$213,000
Interest Rate
3.44%
Mortgage Type
New Conventional
Purchase Details
Closed on
Nov 2, 2009
Sold by
Mhi Partnership Ltd
Bought by
Jackson Stephen Taylor and Jackson Krystle Diane
Home Financials for this Owner
Home Financials are based on the most recent Mortgage that was taken out on this home.
Original Mortgage
$264,042
Interest Rate
5.03%
Mortgage Type
FHA
Purchase Details
Closed on
May 26, 2009
Sold by
Jackson Meadows Partners Lp
Bought by
Mhi Partnership Ltd
Create a Home Valuation Report for This Property
The Home Valuation Report is an in-depth analysis detailing your home's value as well as a comparison with similar homes in the area
Home Values in the Area
Average Home Value in this Area
Purchase History
| Date | Buyer | Sale Price | Title Company |
|---|---|---|---|
| Nguyen Cao T | -- | -- | |
| Nguyen Trang | -- | None Available | |
| Jackson Stephen Taylor | -- | Stnt | |
| Mhi Partnership Ltd | -- | Stnt |
Source: Public Records
Mortgage History
| Date | Status | Borrower | Loan Amount |
|---|---|---|---|
| Previous Owner | Nguyen Trang | $213,000 | |
| Previous Owner | Jackson Stephen Taylor | $264,042 |
Source: Public Records
Tax History Compared to Growth
Tax History
| Year | Tax Paid | Tax Assessment Tax Assessment Total Assessment is a certain percentage of the fair market value that is determined by local assessors to be the total taxable value of land and additions on the property. | Land | Improvement |
|---|---|---|---|---|
| 2025 | $8,409 | $530,530 | $85,000 | $445,530 |
| 2024 | $8,409 | $530,530 | $85,000 | $445,530 |
| 2023 | $8,409 | $472,490 | $70,000 | $402,490 |
| 2022 | $11,305 | $472,490 | $70,000 | $402,490 |
| 2021 | $8,596 | $334,030 | $65,000 | $269,030 |
| 2020 | $8,739 | $334,030 | $65,000 | $269,030 |
| 2019 | $9,475 | $334,030 | $65,000 | $269,030 |
| 2018 | $8,834 | $308,440 | $50,000 | $258,440 |
| 2017 | $8,858 | $308,440 | $50,000 | $258,440 |
| 2016 | $8,858 | $308,440 | $50,000 | $258,440 |
| 2015 | $5,784 | $272,430 | $50,000 | $222,430 |
| 2014 | $5,784 | $233,720 | $50,000 | $183,720 |
Source: Public Records
Map
Nearby Homes
- 2402 Bent Oak Trail
- 2406 Bent Oak Trail
- 4005 Hawthorne Dr
- 2422 Ash Ln
- 2418 Ash Ln
- 2414 Ash Ln
- 2402 Ash Ln
- 4406 Westcreek Ln
- 1641 Ben Davis Rd
- 3417 Rosewood Ln
- 4818 Westcreek Ln
- 3476 Rosewood Ln
- 4924 Westcreek Ln
- TBS Hwy78
- 5014 Brookhollow Dr
- 2006 Cornwall Ln
- 3302 Sewell Dr
- 3703 Stampede Dr
- 5007 Jefferson Dr
- 5100 Murphy Rd
- 2626 Cotillion Dr
- 2522 Cotillion Dr
- 2611 Cotillion Dr
- 2630 Cotillion Dr
- 2518 Cotillion Dr
- 2607 Cotillion Dr
- 2619 Cotillion Dr
- 2537 Cotillion Dr
- 2615 Cotillion Dr
- 2623 Cotillion Dr
- 2514 Cotillion Dr
- 2627 Cotillion Dr
- 2634 Cotillion Dr
- 2533 Cotillion Dr
- 4504 Swingster Ln
- 2529 Cotillion Dr
- 2631 Cotillion Dr
- 2525 Cotillion Dr
- 4401 Jackson Dr
- 2510 Cotillion Dr