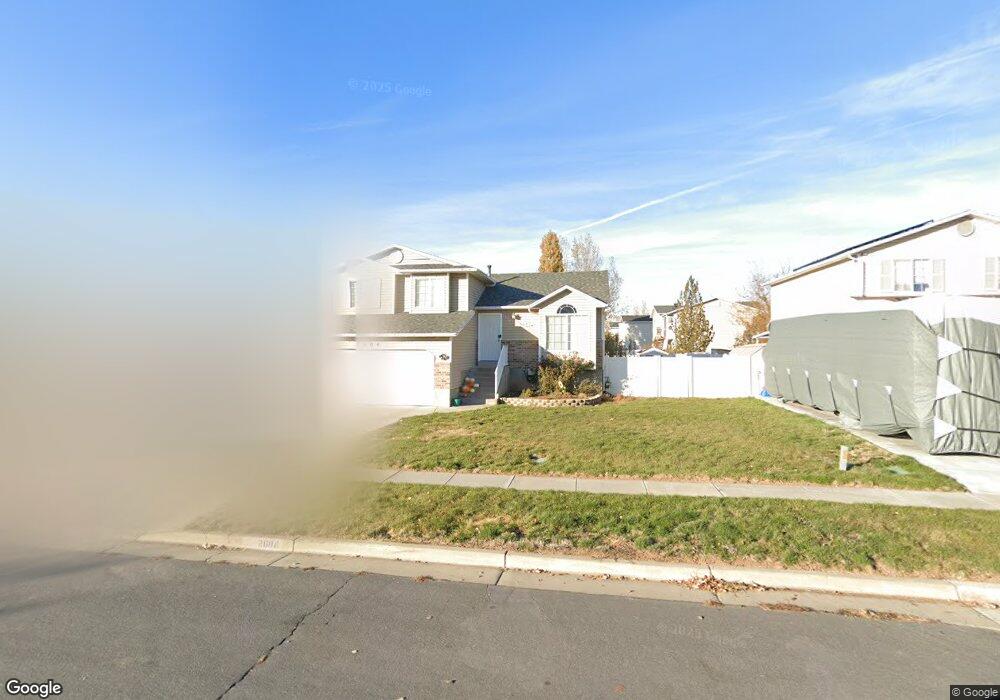
2604 W 1125 N Layton, UT 84041
Estimated Value: $462,000 - $512,000
4
Beds
3
Baths
1,800
Sq Ft
$271/Sq Ft
Est. Value
About This Home
This home is located at 2604 W 1125 N, Layton, UT 84041 and is currently estimated at $487,425, approximately $270 per square foot. 2604 W 1125 N is a home located in Davis County with nearby schools including Ellison Park School, Shoreline Junior High School, and Layton High School.
Ownership History
Date
Name
Owned For
Owner Type
Purchase Details
Closed on
Jul 19, 2005
Sold by
Tate Randall K and Tate Jenny M
Bought by
Hudgens Daniel A and Hudgens Sandrine G
Current Estimated Value
Home Financials for this Owner
Home Financials are based on the most recent Mortgage that was taken out on this home.
Original Mortgage
$132,800
Outstanding Balance
$68,425
Interest Rate
5.46%
Mortgage Type
Fannie Mae Freddie Mac
Estimated Equity
$419,000
Purchase Details
Closed on
Nov 21, 2002
Sold by
Yeates Heidi B and Yeates Matthew J
Bought by
Tate Randall K and Tate Jenny M
Home Financials for this Owner
Home Financials are based on the most recent Mortgage that was taken out on this home.
Original Mortgage
$138,600
Interest Rate
5.89%
Purchase Details
Closed on
Oct 21, 1998
Sold by
Woodside Homes Corp
Bought by
Yeates Matthew J and Yates Heidi B
Home Financials for this Owner
Home Financials are based on the most recent Mortgage that was taken out on this home.
Original Mortgage
$83,700
Interest Rate
6.71%
Create a Home Valuation Report for This Property
The Home Valuation Report is an in-depth analysis detailing your home's value as well as a comparison with similar homes in the area
Home Values in the Area
Average Home Value in this Area
Purchase History
| Date | Buyer | Sale Price | Title Company |
|---|---|---|---|
| Hudgens Daniel A | -- | First American Title | |
| Tate Randall K | -- | First American Title Co | |
| Yeates Matthew J | -- | First American Title Co |
Source: Public Records
Mortgage History
| Date | Status | Borrower | Loan Amount |
|---|---|---|---|
| Open | Hudgens Daniel A | $132,800 | |
| Previous Owner | Tate Randall K | $138,600 | |
| Previous Owner | Yeates Matthew J | $83,700 |
Source: Public Records
Tax History Compared to Growth
Tax History
| Year | Tax Paid | Tax Assessment Tax Assessment Total Assessment is a certain percentage of the fair market value that is determined by local assessors to be the total taxable value of land and additions on the property. | Land | Improvement |
|---|---|---|---|---|
| 2025 | $2,384 | $250,251 | $106,211 | $144,040 |
| 2024 | $2,304 | $243,650 | $118,446 | $125,204 |
| 2023 | $2,210 | $412,000 | $115,293 | $296,707 |
| 2022 | $2,407 | $243,650 | $73,391 | $170,259 |
| 2021 | $2,060 | $311,000 | $110,122 | $200,878 |
| 2020 | $1,837 | $266,000 | $92,264 | $173,736 |
| 2019 | $1,777 | $252,000 | $95,783 | $156,217 |
| 2018 | $1,594 | $227,000 | $83,884 | $143,116 |
| 2016 | $1,427 | $104,830 | $32,390 | $72,440 |
| 2015 | $1,435 | $100,045 | $32,390 | $67,655 |
| 2014 | $512 | $101,547 | $32,390 | $69,157 |
| 2013 | -- | $102,345 | $28,952 | $73,393 |
Source: Public Records
Map
Nearby Homes