Estimated Value: $346,000 - $400,000
3
Beds
2
Baths
1,516
Sq Ft
$241/Sq Ft
Est. Value
About This Home
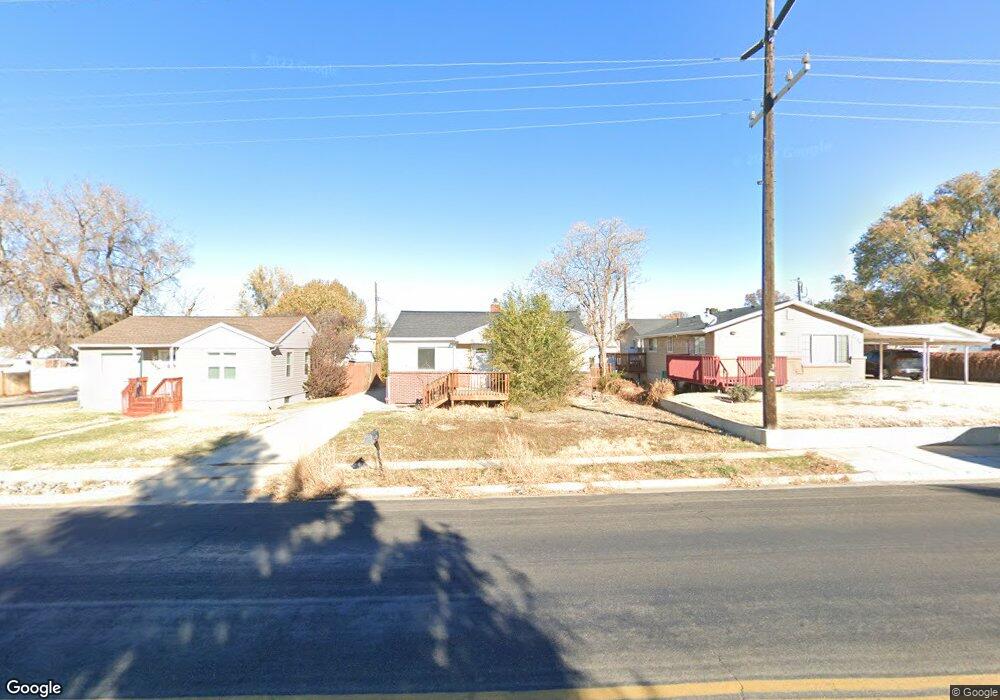
This home is located at 2604 W 6000 S, Roy, UT 84067 and is currently estimated at $365,059, approximately $240 per square foot. 2604 W 6000 S is a home located in Weber County with nearby schools including Municipal School, Roy Junior High School, and Roy High School.
Ownership History
Date
Name
Owned For
Owner Type
Purchase Details
Closed on
Nov 16, 2023
Sold by
Kitchen Dakota
Bought by
Fast Dillon
Current Estimated Value
Home Financials for this Owner
Home Financials are based on the most recent Mortgage that was taken out on this home.
Original Mortgage
$283,920
Outstanding Balance
$278,958
Interest Rate
7.49%
Mortgage Type
New Conventional
Estimated Equity
$86,101
Purchase Details
Closed on
Apr 11, 2022
Sold by
Dakota Kitchen
Bought by
Kitchen Dakota
Home Financials for this Owner
Home Financials are based on the most recent Mortgage that was taken out on this home.
Original Mortgage
$269,500
Interest Rate
3.76%
Mortgage Type
New Conventional
Purchase Details
Closed on
Feb 3, 2021
Sold by
Cruz Itzel Galeana
Bought by
Kitchen Dakota and Turnbow Natalie
Home Financials for this Owner
Home Financials are based on the most recent Mortgage that was taken out on this home.
Original Mortgage
$265,600
Interest Rate
2.65%
Mortgage Type
FHA
Purchase Details
Closed on
Oct 12, 2015
Sold by
Wagers Randall Lee and Wagers Daralette
Bought by
Cruz Itzel Galeana
Home Financials for this Owner
Home Financials are based on the most recent Mortgage that was taken out on this home.
Original Mortgage
$9,043
Interest Rate
3.86%
Mortgage Type
Stand Alone Second
Purchase Details
Closed on
Jan 8, 2013
Sold by
Dosch Campbell
Bought by
Wagers Randall Lee and Wagers Daralette
Home Financials for this Owner
Home Financials are based on the most recent Mortgage that was taken out on this home.
Original Mortgage
$129,117
Interest Rate
3.25%
Mortgage Type
FHA
Purchase Details
Closed on
Jun 19, 2012
Sold by
Federal National Mortgage Association
Bought by
Dosch Campbell
Purchase Details
Closed on
Nov 30, 2011
Sold by
Forster Lavonna
Bought by
Federal National Mortgage Association
Purchase Details
Closed on
Dec 27, 1996
Sold by
Forster Walter F
Bought by
Forster Lavonna
Create a Home Valuation Report for This Property
The Home Valuation Report is an in-depth analysis detailing your home's value as well as a comparison with similar homes in the area
Home Values in the Area
Average Home Value in this Area
Purchase History
| Date | Buyer | Sale Price | Title Company |
|---|---|---|---|
| Fast Dillon | -- | Us Title | |
| Kitchen Dakota | -- | Metro National Title | |
| Kitchen Dakota | -- | Monument Title Ins Inc | |
| Cruz Itzel Galeana | -- | Security Title Of Davis Cnty | |
| Wagers Randall Lee | -- | Bonneville Superior Title Co | |
| Dosch Campbell | -- | Highland Title | |
| Federal National Mortgage Association | $73,893 | Etitle Insurance Agency | |
| Forster Lavonna | -- | -- |
Source: Public Records
Mortgage History
| Date | Status | Borrower | Loan Amount |
|---|---|---|---|
| Open | Fast Dillon | $283,920 | |
| Previous Owner | Kitchen Dakota | $269,500 | |
| Previous Owner | Kitchen Dakota | $265,600 | |
| Previous Owner | Cruz Itzel Galeana | $9,043 | |
| Previous Owner | Cruz Itzel Galeana | $150,719 | |
| Previous Owner | Wagers Randall Lee | $129,117 |
Source: Public Records
Tax History
| Year | Tax Paid | Tax Assessment Tax Assessment Total Assessment is a certain percentage of the fair market value that is determined by local assessors to be the total taxable value of land and additions on the property. | Land | Improvement |
|---|---|---|---|---|
| 2025 | $2,261 | $351,997 | $98,828 | $253,169 |
| 2024 | $2,184 | $188,098 | $54,364 | $133,734 |
| 2023 | $1,919 | $163,350 | $52,764 | $110,586 |
| 2022 | $2,247 | $201,302 | $49,969 | $151,333 |
| 2021 | $1,720 | $250,000 | $58,905 | $191,095 |
| 2020 | $1,643 | $220,000 | $58,905 | $161,095 |
| 2019 | $1,701 | $216,000 | $35,954 | $180,046 |
| 2018 | $1,552 | $184,000 | $31,430 | $152,570 |
| 2017 | $1,360 | $149,001 | $33,796 | $115,205 |
| 2016 | $1,220 | $70,870 | $18,736 | $52,134 |
| 2015 | $1,185 | $70,721 | $21,415 | $49,306 |
| 2014 | $1,140 | $66,896 | $16,031 | $50,865 |
Source: Public Records
Map
Nearby Homes
Your Personal Tour Guide
Ask me questions while you tour the home.