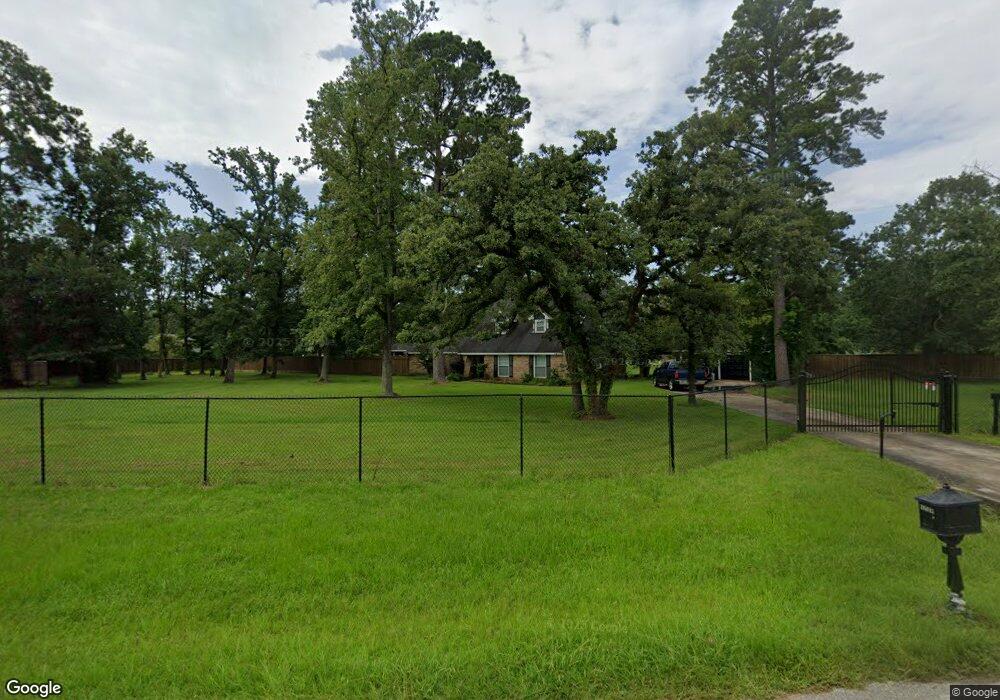
26045 Andy Ln Magnolia, TX 77354
Estimated Value: $563,000 - $706,000
--
Bed
3
Baths
3,052
Sq Ft
$208/Sq Ft
Est. Value
About This Home
This home is located at 26045 Andy Ln, Magnolia, TX 77354 and is currently estimated at $635,908, approximately $208 per square foot. 26045 Andy Ln is a home located in Montgomery County with nearby schools including Decker Prairie Elementary School, Tomball Intermediate School, and Tomball Junior High School.
Ownership History
Date
Name
Owned For
Owner Type
Purchase Details
Closed on
Nov 21, 2007
Sold by
Krenek Michael James
Bought by
Parker Shannoan
Current Estimated Value
Home Financials for this Owner
Home Financials are based on the most recent Mortgage that was taken out on this home.
Original Mortgage
$174,400
Outstanding Balance
$109,659
Interest Rate
6.26%
Mortgage Type
Purchase Money Mortgage
Estimated Equity
$526,249
Purchase Details
Closed on
Dec 29, 2005
Sold by
Krenek Rebecca Sue Weeks
Bought by
Krenek Michael James
Purchase Details
Closed on
May 19, 1998
Sold by
Aubert George A and Aubert Linda F
Bought by
Krenek Michael J and Krenek Rebecca S
Home Financials for this Owner
Home Financials are based on the most recent Mortgage that was taken out on this home.
Original Mortgage
$161,500
Interest Rate
7.11%
Create a Home Valuation Report for This Property
The Home Valuation Report is an in-depth analysis detailing your home's value as well as a comparison with similar homes in the area
Home Values in the Area
Average Home Value in this Area
Purchase History
| Date | Buyer | Sale Price | Title Company |
|---|---|---|---|
| Parker Shannoan | -- | First American Title | |
| Krenek Michael James | -- | -- | |
| Krenek Michael J | -- | Chicago Title |
Source: Public Records
Mortgage History
| Date | Status | Borrower | Loan Amount |
|---|---|---|---|
| Open | Parker Shannoan | $174,400 | |
| Previous Owner | Krenek Michael J | $161,500 | |
| Closed | Krenek Michael James | $0 |
Source: Public Records
Tax History Compared to Growth
Tax History
| Year | Tax Paid | Tax Assessment Tax Assessment Total Assessment is a certain percentage of the fair market value that is determined by local assessors to be the total taxable value of land and additions on the property. | Land | Improvement |
|---|---|---|---|---|
| 2025 | $5,133 | $428,050 | -- | -- |
| 2024 | $4,551 | $389,136 | -- | -- |
| 2023 | $4,551 | $353,760 | $298,600 | $216,930 |
| 2022 | $5,941 | $321,600 | $291,440 | $223,110 |
| 2021 | $5,618 | $292,360 | $83,610 | $236,860 |
| 2020 | $5,327 | $265,780 | $83,610 | $250,250 |
| 2019 | $4,771 | $241,620 | $83,610 | $158,010 |
| 2018 | $5,271 | $284,950 | $83,610 | $201,340 |
| 2017 | $5,650 | $271,480 | $41,130 | $241,850 |
| 2016 | $5,136 | $246,800 | $41,130 | $205,670 |
| 2015 | $4,496 | $244,710 | $41,130 | $205,670 |
| 2014 | $4,496 | $222,460 | $41,130 | $181,330 |
Source: Public Records
Map
Nearby Homes
- 26050 Andy Ln
- 26032 Hardin Store Rd
- TRACT 6B1-2 Mury Bartley
- 26028 Hardin Store Rd
- 316 Louvenia Ct
- 317 Louvenia Ct
- 331 Louvenia Ct
- 322 Louvenia Ct
- 358 Louvenia Ct
- 223 Gonsoulin Ln
- 26320 Pin Oak Dr
- 26527 Bayou Tesch Dr
- 25429 Hardin Store Rd
- 26422 Hardin Store Rd
- 25432 Hardin Store Rd
- 1223 Virgie Community Rd
- 11919 Hickory Wood St
- 1107 Virgie Community Rd
- 12110 Hillcrest Dr
- 0 TBD Cripple Creek Dr
- 26037 Andy Ln
- 26038 Andy Ln
- 26046 Andy Ln
- 26102 Rimwick Forest Dr
- 26103 Rimwick Forest Dr
- 25919 Mulberry Ct
- 26030 Andy Ln
- 26110 Rimwick Forest Dr
- 26014 Greentree St
- 26014 Green Tree St
- 26021 Andy Ln
- 26032 Andy Ln
- 26107 Rimwick Forest Dr
- 25910 Green Tree St
- 26210 Rimwick Forest Dr
- 25911 Mulberry Ct
- 26015 Andy Ln
- 26010 Andy Ln
- 26203 Rimwick Forest Dr
- 26015 Green Tree St