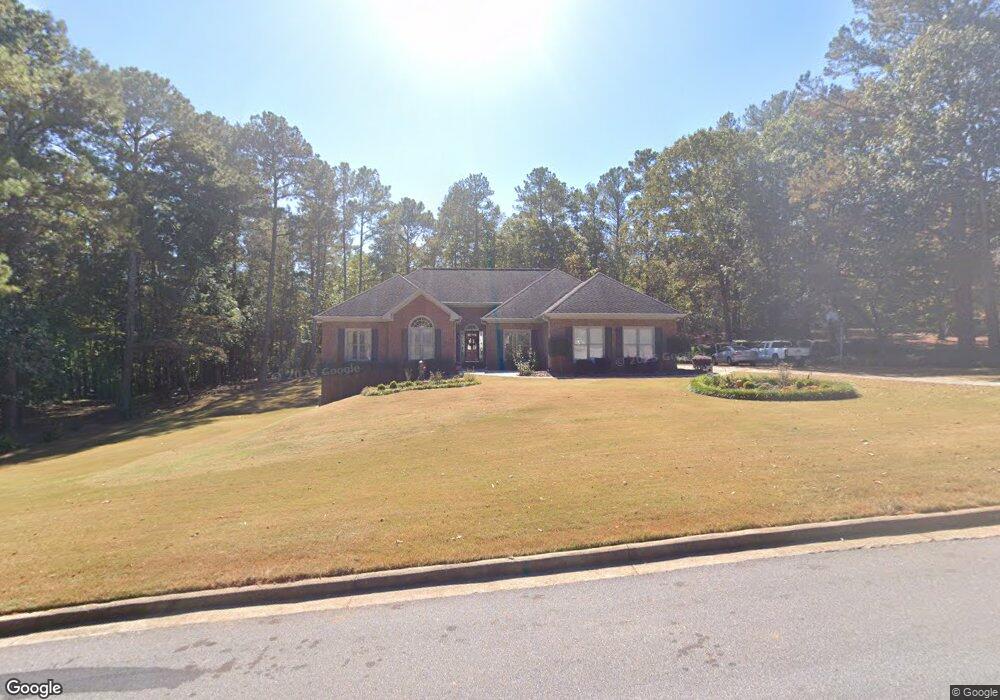
2605 Fireside Trail SW Conyers, GA 30094
Estimated Value: $424,000 - $445,000
3
Beds
3
Baths
3,577
Sq Ft
$121/Sq Ft
Est. Value
About This Home
This home is located at 2605 Fireside Trail SW, Conyers, GA 30094 and is currently estimated at $433,716, approximately $121 per square foot. 2605 Fireside Trail SW is a home located in Rockdale County with nearby schools including Sims Elementary School, Edwards Middle School, and Heritage High School.
Ownership History
Date
Name
Owned For
Owner Type
Purchase Details
Closed on
Mar 31, 2017
Sold by
Gray Keith
Bought by
Ellis Jones
Current Estimated Value
Home Financials for this Owner
Home Financials are based on the most recent Mortgage that was taken out on this home.
Original Mortgage
$239,000
Outstanding Balance
$198,282
Interest Rate
4.1%
Mortgage Type
VA
Estimated Equity
$235,434
Purchase Details
Closed on
Apr 28, 2003
Sold by
Gray Keith A
Bought by
Gray Keith and Gray Cindy
Home Financials for this Owner
Home Financials are based on the most recent Mortgage that was taken out on this home.
Original Mortgage
$129,000
Interest Rate
5.79%
Mortgage Type
New Conventional
Purchase Details
Closed on
Nov 10, 1993
Sold by
R R Custom Homes I Nc
Bought by
Gray Keith A and Gray Cynthia
Home Financials for this Owner
Home Financials are based on the most recent Mortgage that was taken out on this home.
Original Mortgage
$148,900
Interest Rate
6.97%
Create a Home Valuation Report for This Property
The Home Valuation Report is an in-depth analysis detailing your home's value as well as a comparison with similar homes in the area
Home Values in the Area
Average Home Value in this Area
Purchase History
| Date | Buyer | Sale Price | Title Company |
|---|---|---|---|
| Ellis Jones | $239,000 | -- | |
| Gray Keith | -- | -- | |
| Gray Keith A | $168,900 | -- |
Source: Public Records
Mortgage History
| Date | Status | Borrower | Loan Amount |
|---|---|---|---|
| Open | Ellis Jones | $239,000 | |
| Previous Owner | Gray Keith | $129,000 | |
| Previous Owner | Gray Keith A | $148,900 |
Source: Public Records
Tax History Compared to Growth
Tax History
| Year | Tax Paid | Tax Assessment Tax Assessment Total Assessment is a certain percentage of the fair market value that is determined by local assessors to be the total taxable value of land and additions on the property. | Land | Improvement |
|---|---|---|---|---|
| 2024 | $3,966 | $159,920 | $31,360 | $128,560 |
| 2023 | $3,348 | $140,960 | $29,080 | $111,880 |
| 2022 | $3,133 | $132,600 | $29,080 | $103,520 |
| 2021 | $2,598 | $105,040 | $17,200 | $87,840 |
| 2020 | $2,836 | $109,520 | $21,680 | $87,840 |
| 2019 | $4,227 | $94,160 | $15,840 | $78,320 |
| 2018 | $4,154 | $92,120 | $13,800 | $78,320 |
| 2017 | $2,053 | $80,440 | $10,720 | $69,720 |
| 2016 | $1,895 | $80,440 | $10,720 | $69,720 |
| 2015 | $1,801 | $77,080 | $12,000 | $65,080 |
| 2014 | $1,608 | $77,080 | $12,000 | $65,080 |
| 2013 | -- | $78,680 | $18,000 | $60,680 |
Source: Public Records
Map
Nearby Homes
- 2630 Hwy 138
- 2402 Highway 138 SW
- 2352 Highway 138 SW
- 3284 Creekside Dr SE
- 309 Cedar Hollow Dr
- 2340 New Haven Place Unit 3
- 3412 Kinsley Ct
- 3080 Highway 212 SW
- 2150 Smyrna Ridge Ct SW
- 321 Yukon Dr Unit 68
- 403 Whitehorse Way Unit 41
- 327 Yukon Dr Unit 65
- 339 Yukon Dr Unit 59
- 329 Yukon Dr Unit 64
- 3009 Inverness Ct
- 2568 Oneal Rd SW Unit 4
- 2572 Oneal Rd SW Unit 3
- 2609 Fireside Trail SW
- 2604 Fireside Trail SW
- 2601 Fireside Trail SW
- 2505 Chimney Ridge Dr SW
- 2600 Fireside Trail SW
- 2608 Fireside Trail SW Unit 2
- 2503 Chimney Ridge Dr SW
- 2511 Chimney Ridge Dr SW
- 0 Chimney Ridge Dr SW Unit 3277097
- 0 Chimney Ridge Dr SW Unit 8164988
- 0 Chimney Ridge Dr SW Unit 7426378
- 2612 Fireside Trail SW
- 2608 Mantle Place SW
- 2613 Fireside Trail SW
- 2513 Chimney Ridge Dr SW
- 2506 Chimney Ridge Dr SW
- 2501 Chimney Ridge Dr SW
- 2504 Chimney Ridge Dr SW
- 0 Fireside Trail SW Unit 8464562
- 2721 Owens Dr SW