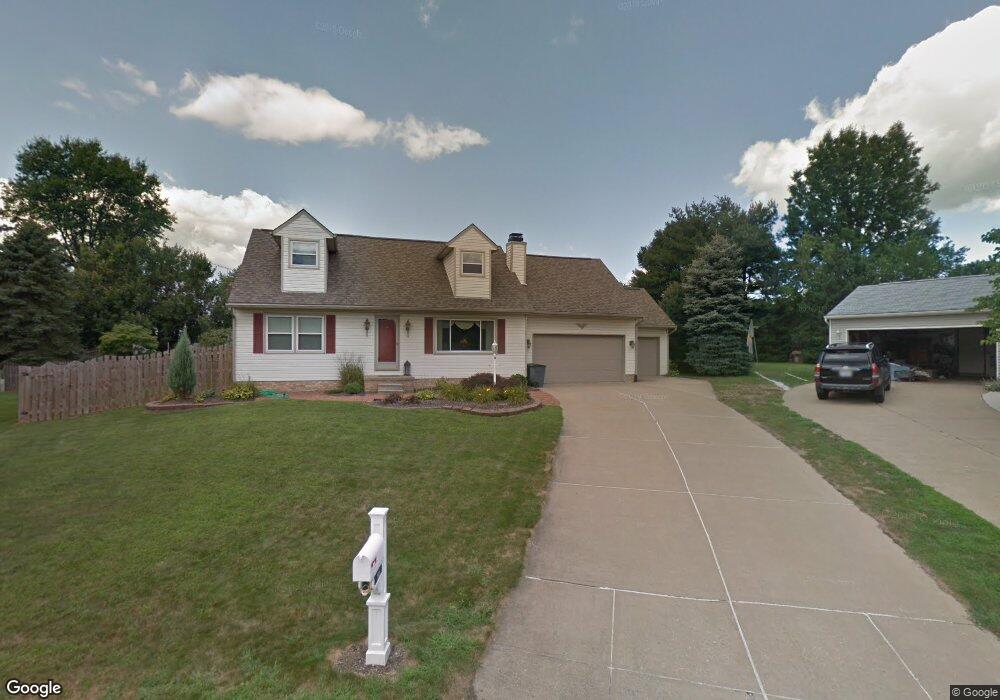
2605 Highgate Cir NW North Canton, OH 44720
Estimated Value: $279,000 - $332,000
4
Beds
2
Baths
2,128
Sq Ft
$143/Sq Ft
Est. Value
About This Home
This home is located at 2605 Highgate Cir NW, North Canton, OH 44720 and is currently estimated at $303,460, approximately $142 per square foot. 2605 Highgate Cir NW is a home located in Stark County with nearby schools including Northwood Elementary School, North Canton Middle School, and Hoover High School.
Ownership History
Date
Name
Owned For
Owner Type
Purchase Details
Closed on
Oct 28, 2011
Sold by
Lewis David W and Lewis Colleen L
Bought by
Mennell James A
Current Estimated Value
Home Financials for this Owner
Home Financials are based on the most recent Mortgage that was taken out on this home.
Original Mortgage
$142,400
Outstanding Balance
$97,571
Interest Rate
4.12%
Mortgage Type
New Conventional
Estimated Equity
$205,889
Purchase Details
Closed on
Oct 8, 2007
Sold by
Esber J C Norman and Esber Carolyn M
Bought by
Lewis David W
Home Financials for this Owner
Home Financials are based on the most recent Mortgage that was taken out on this home.
Original Mortgage
$132,000
Interest Rate
6.5%
Mortgage Type
Purchase Money Mortgage
Create a Home Valuation Report for This Property
The Home Valuation Report is an in-depth analysis detailing your home's value as well as a comparison with similar homes in the area
Home Values in the Area
Average Home Value in this Area
Purchase History
| Date | Buyer | Sale Price | Title Company |
|---|---|---|---|
| Mennell James A | $149,900 | Attorney | |
| Lewis David W | $165,000 | Attorney |
Source: Public Records
Mortgage History
| Date | Status | Borrower | Loan Amount |
|---|---|---|---|
| Open | Mennell James A | $142,400 | |
| Previous Owner | Lewis David W | $132,000 |
Source: Public Records
Tax History Compared to Growth
Tax History
| Year | Tax Paid | Tax Assessment Tax Assessment Total Assessment is a certain percentage of the fair market value that is determined by local assessors to be the total taxable value of land and additions on the property. | Land | Improvement |
|---|---|---|---|---|
| 2025 | -- | $76,620 | $23,000 | $53,620 |
| 2024 | -- | $76,620 | $23,000 | $53,620 |
| 2023 | $3,862 | $65,950 | $16,000 | $49,950 |
| 2022 | $1,862 | $65,950 | $16,000 | $49,950 |
| 2021 | $3,825 | $65,950 | $16,000 | $49,950 |
| 2020 | $3,712 | $58,590 | $13,790 | $44,800 |
| 2019 | $3,498 | $58,600 | $13,800 | $44,800 |
| 2018 | $3,612 | $58,600 | $13,800 | $44,800 |
| 2017 | $3,185 | $53,030 | $12,080 | $40,950 |
| 2016 | $3,199 | $53,030 | $12,080 | $40,950 |
| 2015 | $3,104 | $53,030 | $12,080 | $40,950 |
| 2014 | $921 | $48,030 | $10,960 | $37,070 |
| 2013 | $1,428 | $48,030 | $10,960 | $37,070 |
Source: Public Records
Map
Nearby Homes
- 8031 Woodrush Dr NW
- 7995 Woodrush Dr NW
- 2626 Northam Cir NW
- 7831 Windbur Cir NW
- 7840 Newgate Ave NW
- 2825 River Run Cir NW
- 2452 Purdue Cir NW
- 7890 Killington Ave NW
- 8173 Spencer Ave NW
- 8037 Norriton Cir NW
- 2677 Radford St NW
- 7907 Amberly Cir NW Unit 7
- 2684 Fordham Cir NW
- 2840 Barclay Cir NW
- 7420 Carmen Dr NW
- 8510 Deacon Ave NW
- 2884 Sutherland Cir NW
- 3278 Sumser St NW Unit 2
- 8171 Pheasant Ave NW
- 2119 Mcginty Rd NW
- 2606 Highgate Cir NW
- 8060 Woodrush Dr NW
- 8076 Woodrush Dr NW
- 8046 Woodrush Dr NW
- 2585 Highgate Cir NW
- 8090 Woodrush Dr NW
- 2614 Crafton Cir NW
- 2592 Highgate Cir NW
- 2586 Highgate Cir NW
- 8028 Woodrush Dr NW
- 8104 Woodrush Dr NW
- 2569 Highgate Cir NW
- 2588 Crafton Cir NW
- 8010 Woodrush Dr NW
- 2570 Highgate Cir NW
- 7986 Woodrush Dr NW
- 7998 Woodrush Dr NW
- 8075 Woodrush Dr NW
- 8059 Woodrush Dr NW
- 2553 Highgate Cir NW