2605 Roberts Ave Waukegan, IL 60087
Estimated Value: $267,000 - $278,000
3
Beds
2
Baths
1,562
Sq Ft
$174/Sq Ft
Est. Value
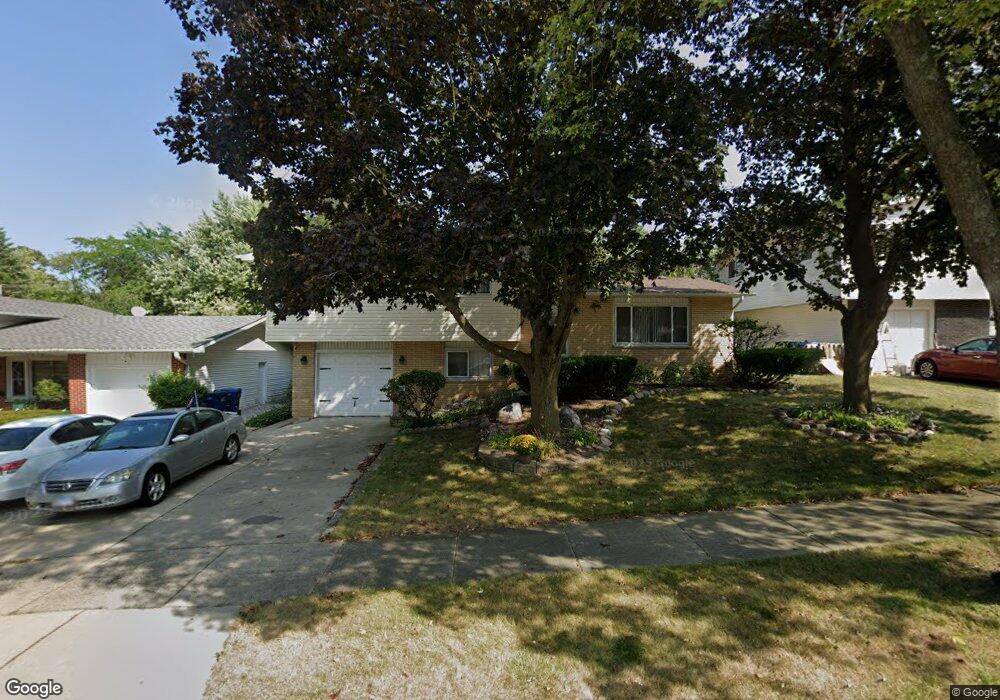
About This Home
This home is located at 2605 Roberts Ave, Waukegan, IL 60087 and is currently estimated at $271,287, approximately $173 per square foot. 2605 Roberts Ave is a home located in Lake County with nearby schools including Oakdale Elementary School, Jack Benny Middle School, and Waukegan High School.
Ownership History
Date
Name
Owned For
Owner Type
Purchase Details
Closed on
Jun 22, 2011
Sold by
Torres Conrado and Torres Rosa
Bought by
Ortega Alejandro Villalobos and Villalobos Angelica
Current Estimated Value
Home Financials for this Owner
Home Financials are based on the most recent Mortgage that was taken out on this home.
Original Mortgage
$92,591
Outstanding Balance
$65,655
Interest Rate
5.25%
Mortgage Type
FHA
Estimated Equity
$205,632
Purchase Details
Closed on
Sep 28, 2005
Sold by
Rodriguez Cirilo and Rodriguez Guadalupe
Bought by
Torres Conrado and Torres Rosa
Home Financials for this Owner
Home Financials are based on the most recent Mortgage that was taken out on this home.
Original Mortgage
$160,800
Interest Rate
5.83%
Mortgage Type
Fannie Mae Freddie Mac
Create a Home Valuation Report for This Property
The Home Valuation Report is an in-depth analysis detailing your home's value as well as a comparison with similar homes in the area
Home Values in the Area
Average Home Value in this Area
Purchase History
| Date | Buyer | Sale Price | Title Company |
|---|---|---|---|
| Ortega Alejandro Villalobos | $95,000 | Fidelity National Title | |
| Torres Conrado | $201,000 | First American Title |
Source: Public Records
Mortgage History
| Date | Status | Borrower | Loan Amount |
|---|---|---|---|
| Open | Ortega Alejandro Villalobos | $92,591 | |
| Previous Owner | Torres Conrado | $160,800 |
Source: Public Records
Tax History Compared to Growth
Tax History
| Year | Tax Paid | Tax Assessment Tax Assessment Total Assessment is a certain percentage of the fair market value that is determined by local assessors to be the total taxable value of land and additions on the property. | Land | Improvement |
|---|---|---|---|---|
| 2024 | $5,449 | $73,035 | $12,781 | $60,254 |
| 2023 | $5,449 | $65,784 | $11,443 | $54,341 |
| 2022 | $4,925 | $56,377 | $11,554 | $44,823 |
| 2021 | $4,427 | $50,462 | $10,306 | $40,156 |
| 2020 | $4,422 | $47,011 | $9,601 | $37,410 |
| 2019 | $4,626 | $43,078 | $8,798 | $34,280 |
| 2018 | $4,737 | $43,017 | $11,380 | $31,637 |
| 2017 | $4,560 | $38,058 | $10,068 | $27,990 |
| 2016 | $3,805 | $30,621 | $8,100 | $22,521 |
| 2015 | $3,616 | $27,407 | $7,250 | $20,157 |
| 2014 | $3,374 | $25,480 | $6,519 | $18,961 |
| 2012 | $4,401 | $27,605 | $7,063 | $20,542 |
Source: Public Records
Map
Nearby Homes
- 2708 Dana Ave
- 2705 Dana Ave
- 12312 W Audrey Ave
- 2713 Varonen Ave
- 2613 N Lewis Ave
- 3101 Country Club Ln
- 2350 N Lewis Ave
- 36955 N Garrick Ave
- 3032 W Vermont Ave
- 1612 Whitney St
- 3320 Sunset Ave
- 3211 Rugby Ct
- 36245 N Green Bay Rd
- 1636 Rice St
- 2928 W Country Club Ave
- 3000 W Country Club Ave
- 2946 W Country Club Ave
- 1913 Chippewa Rd
- 2440 W Cheyenne Rd
- 12535 W Blanchard Rd
- 2601 Roberts Ave
- 2609 Roberts Ave
- 2533 Roberts Ave
- 2609 Blanchard Rd
- 2539 Roberts Ave
- 2606 Roberts Ave
- 2610 Roberts Ave
- 2602 Roberts Ave
- 2534 Roberts Ave
- 2544 N Mcaree Rd
- 2530 Roberts Ave
- 2625 Blanchard Rd
- 2605 N Mcaree Rd
- 2601 N Mcaree Rd
- 2611 N Mcaree Rd
- 2614 Jacquelyn Ln
- 2621 Blanchard Rd
- 2620 Roberts Ave
- 2625 Roberts Ave
- 2547 N Mcaree Rd