2605 Springbluff Ct Buford, GA 30519
Estimated Value: $912,801 - $1,196,000
6
Beds
6
Baths
6,383
Sq Ft
$162/Sq Ft
Est. Value
About This Home
This home is located at 2605 Springbluff Ct, Buford, GA 30519 and is currently estimated at $1,033,200, approximately $161 per square foot. 2605 Springbluff Ct is a home located in Gwinnett County with nearby schools including Patrick Elementary School, Glenn C. Jones Middle School, and Oak Hill Classical School.
Ownership History
Date
Name
Owned For
Owner Type
Purchase Details
Closed on
Jun 24, 2025
Sold by
Kazemian Mostafa
Bought by
Kazemian Austin Mostafa Tr and Kazemian Ghazal O Tr
Current Estimated Value
Purchase Details
Closed on
Jun 4, 2015
Sold by
Arnold Jonathan
Bought by
Kazemian Mostafa and Kazemian Ghazal
Home Financials for this Owner
Home Financials are based on the most recent Mortgage that was taken out on this home.
Original Mortgage
$417,000
Interest Rate
3.88%
Mortgage Type
New Conventional
Purchase Details
Closed on
May 21, 2010
Sold by
Tran Cao H
Bought by
Arnold Jonathan and Arnold Elizabeth
Home Financials for this Owner
Home Financials are based on the most recent Mortgage that was taken out on this home.
Original Mortgage
$372,000
Interest Rate
5.02%
Mortgage Type
New Conventional
Purchase Details
Closed on
Dec 28, 2006
Sold by
Blw South Llc
Bought by
Tran Cao H
Home Financials for this Owner
Home Financials are based on the most recent Mortgage that was taken out on this home.
Original Mortgage
$592,000
Interest Rate
6.07%
Mortgage Type
New Conventional
Create a Home Valuation Report for This Property
The Home Valuation Report is an in-depth analysis detailing your home's value as well as a comparison with similar homes in the area
Home Values in the Area
Average Home Value in this Area
Purchase History
| Date | Buyer | Sale Price | Title Company |
|---|---|---|---|
| Kazemian Austin Mostafa Tr | -- | -- | |
| Kazemian Mostafa | $560,000 | -- | |
| Arnold Jonathan | $465,000 | -- | |
| Tran Cao H | $740,000 | -- |
Source: Public Records
Mortgage History
| Date | Status | Borrower | Loan Amount |
|---|---|---|---|
| Previous Owner | Kazemian Mostafa | $417,000 | |
| Previous Owner | Kazemian Mostafa | $86,440 | |
| Previous Owner | Arnold Jonathan | $372,000 | |
| Previous Owner | Tran Cao H | $592,000 |
Source: Public Records
Tax History
| Year | Tax Paid | Tax Assessment Tax Assessment Total Assessment is a certain percentage of the fair market value that is determined by local assessors to be the total taxable value of land and additions on the property. | Land | Improvement |
|---|---|---|---|---|
| 2025 | $10,251 | $334,760 | $60,800 | $273,960 |
| 2024 | $10,433 | $334,760 | $60,800 | $273,960 |
| 2023 | $10,433 | $334,760 | $60,800 | $273,960 |
| 2022 | $10,414 | $334,760 | $60,800 | $273,960 |
| 2021 | $8,777 | $247,960 | $48,400 | $199,560 |
| 2020 | $8,836 | $247,960 | $48,400 | $199,560 |
| 2019 | $8,532 | $247,960 | $48,400 | $199,560 |
| 2018 | $8,553 | $247,960 | $48,400 | $199,560 |
| 2016 | $8,042 | $219,160 | $44,000 | $175,160 |
| 2015 | $7,248 | $203,120 | $35,600 | $167,520 |
| 2014 | -- | $213,880 | $35,600 | $178,280 |
Source: Public Records
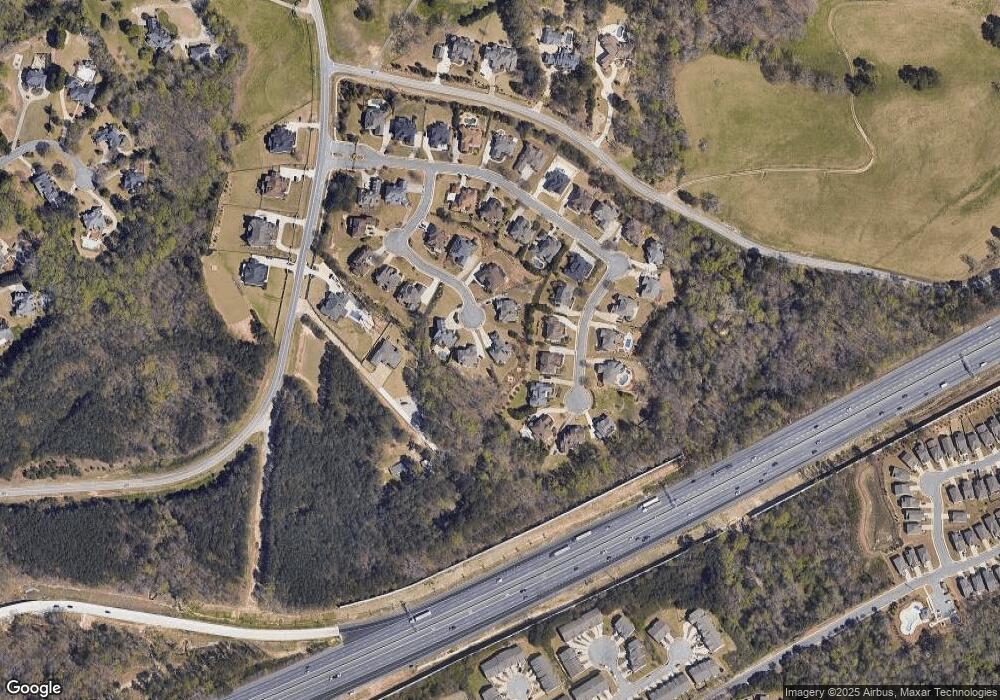
Map
Nearby Homes
- 2655 Camp Branch Rd
- 2508 Morgan Chase Dr
- 3675 Morgan Rd
- 2760 Camp Branch Rd
- 2815 Ivy Brook Ln
- 2770 Camp Branch Rd
- 2779 Morgan Spring Trail
- 2730-B Camp Branch Rd
- 2730-C Camp Branch Rd
- 2299 Misty Ivy Ct
- 2256 Hansford Pass
- 2233 Hansford Pass
- 3007 Humdala Place
- 2557 Woodford Ln
- 3025 Humdala Place
- 3027 Humdala Place
- 2928 Alliteration Ave
- 2364 Allsborough Way
- 3021 Humdala Place
- 2860 Habibi Ct
- 2605 Springbluff Ct
- 2610 Springbluff Ct
- 2943 Springbluff Ln
- 2615 Springbluff Ct
- 2933 Springbluff Ln
- 2620 Springbluff Ct
- 2963 Springbluff Ln
- 2923 Springbluff Ln Unit 22
- 2923 Springbluff Ln
- 2635 Camp Branch Rd
- 2625 Springbluff Ct
- 2942 Springbluff Ln Unit 15
- 2942 Springbluff Ln
- 2640 Springbluff Ct
- 2973 Springbluff Ln
- 2635 Springbluff Ct
- 2863 Springbluff Ln
- 2873 Springbluff Ln
- 2853 Springbluff Ln
- 2962 Springbluff Ln
Your Personal Tour Guide
Ask me questions while you tour the home.