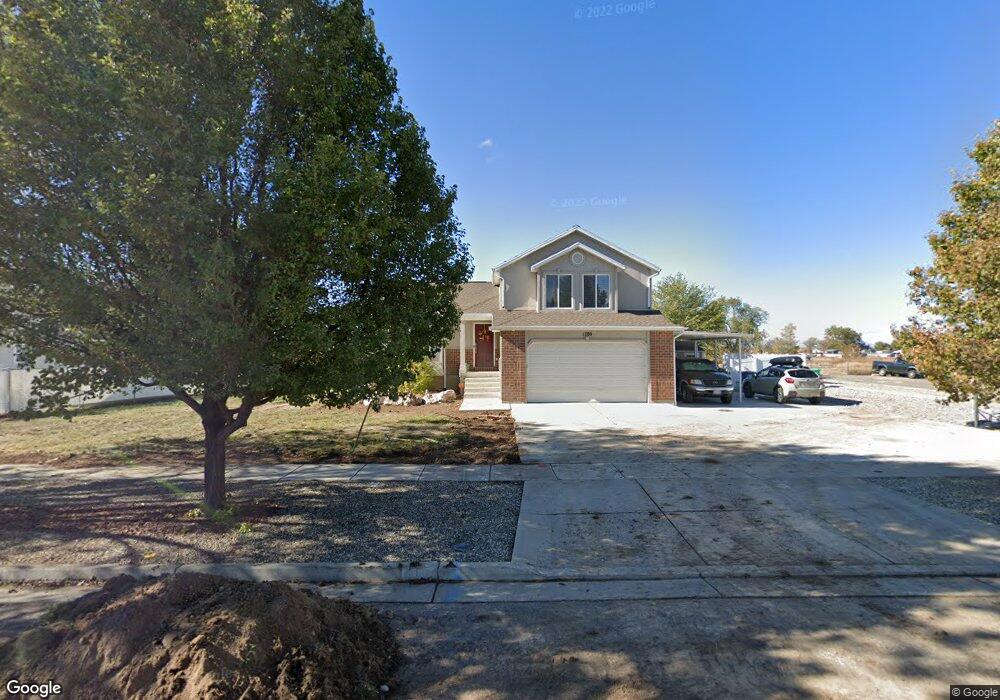
2605 W 1770 S Syracuse, UT 84075
Estimated Value: $493,000 - $554,000
3
Beds
3
Baths
1,682
Sq Ft
$314/Sq Ft
Est. Value
About This Home
This home is located at 2605 W 1770 S, Syracuse, UT 84075 and is currently estimated at $527,612, approximately $313 per square foot. 2605 W 1770 S is a home located in Davis County with nearby schools including Syracuse Elementary School, Syracuse Junior High School, and Syracuse High School.
Ownership History
Date
Name
Owned For
Owner Type
Purchase Details
Closed on
Sep 14, 2012
Sold by
Diaz Joel M
Bought by
Diaz Joel M and Diaz Amy
Current Estimated Value
Home Financials for this Owner
Home Financials are based on the most recent Mortgage that was taken out on this home.
Original Mortgage
$142,300
Outstanding Balance
$60,927
Interest Rate
3.55%
Mortgage Type
New Conventional
Estimated Equity
$466,685
Purchase Details
Closed on
Jan 7, 2003
Sold by
Mckinlay Cory
Bought by
Diaz Joel M
Home Financials for this Owner
Home Financials are based on the most recent Mortgage that was taken out on this home.
Original Mortgage
$142,500
Interest Rate
6.06%
Purchase Details
Closed on
Apr 8, 2002
Sold by
Craythorne Inc
Bought by
Mckinlay Cory and Diaz Joel M
Home Financials for this Owner
Home Financials are based on the most recent Mortgage that was taken out on this home.
Original Mortgage
$3,700
Interest Rate
6.78%
Mortgage Type
Seller Take Back
Create a Home Valuation Report for This Property
The Home Valuation Report is an in-depth analysis detailing your home's value as well as a comparison with similar homes in the area
Home Values in the Area
Average Home Value in this Area
Purchase History
| Date | Buyer | Sale Price | Title Company |
|---|---|---|---|
| Diaz Joel M | -- | Sutherland Title Co | |
| Diaz Joel M | -- | Bonneville Title Company Inc | |
| Mckinlay Cory | -- | Bonneville Title Company Inc |
Source: Public Records
Mortgage History
| Date | Status | Borrower | Loan Amount |
|---|---|---|---|
| Open | Diaz Joel M | $142,300 | |
| Closed | Diaz Joel M | $142,500 | |
| Previous Owner | Mckinlay Cory | $3,700 |
Source: Public Records
Tax History Compared to Growth
Tax History
| Year | Tax Paid | Tax Assessment Tax Assessment Total Assessment is a certain percentage of the fair market value that is determined by local assessors to be the total taxable value of land and additions on the property. | Land | Improvement |
|---|---|---|---|---|
| 2025 | $2,639 | $254,650 | $122,062 | $132,588 |
| 2024 | $2,610 | $253,550 | $104,229 | $149,321 |
| 2023 | $2,418 | $428,000 | $145,040 | $282,960 |
| 2022 | $2,607 | $253,000 | $83,036 | $169,964 |
| 2021 | $2,350 | $353,000 | $123,084 | $229,916 |
| 2020 | $2,104 | $306,000 | $105,568 | $200,432 |
| 2019 | $2,034 | $292,000 | $105,211 | $186,789 |
| 2018 | $1,860 | $265,000 | $100,520 | $164,480 |
| 2016 | $1,677 | $125,290 | $38,507 | $86,783 |
| 2015 | $1,618 | $115,170 | $38,507 | $76,663 |
| 2014 | $1,393 | $101,025 | $38,507 | $62,518 |
| 2013 | -- | $96,250 | $32,602 | $63,648 |
Source: Public Records
Map
Nearby Homes
- 2679 W Antelope Dr
- 1918 S 2465 W
- 4344 W 1825 S Unit 102
- 4354 W 1825 S Unit 104
- 4348 W 1825 S Unit 103
- 1641 S 2350 W Unit B
- 2982 S 3000 W
- 2912 S 3000 W
- 2236 S 2685 W
- 1932 S 2150 W
- 2297 W 2175 S
- 2136 W 2200 S
- 2961 S 2425 W Unit 1123
- 2104 W 2200 S
- 2726 2495 S Unit 205
- 2840 W 1200 S
- 2047 S 2000 W
- 2655 S 2430 W Unit 120
- 2665 S 2430 W Unit 118
- 2655 S 2430 W Unit 116
- 2577 W 1770 S
- 1808 S 2590 W
- 2594 W 1770 S
- 2608 W 1770 S
- 2608 W 1770 S Unit 5
- 1809 S 2590 W
- 2578 W 1770 S
- 1826 S 2590 W
- 1826 S 2590 W Unit 39
- 2561 W 1770 S
- 2576 W 1850 S
- 2553 W 1770 S
- 2562 W 1770 S
- 2583 W 1700 S
- 2583 W 1700 S Unit 2
- 2597 W 1700 S
- 2635 W 1700 S
- 2564 W 1850 S
- 1844 S 2590 W
- 2567 W 1700 S