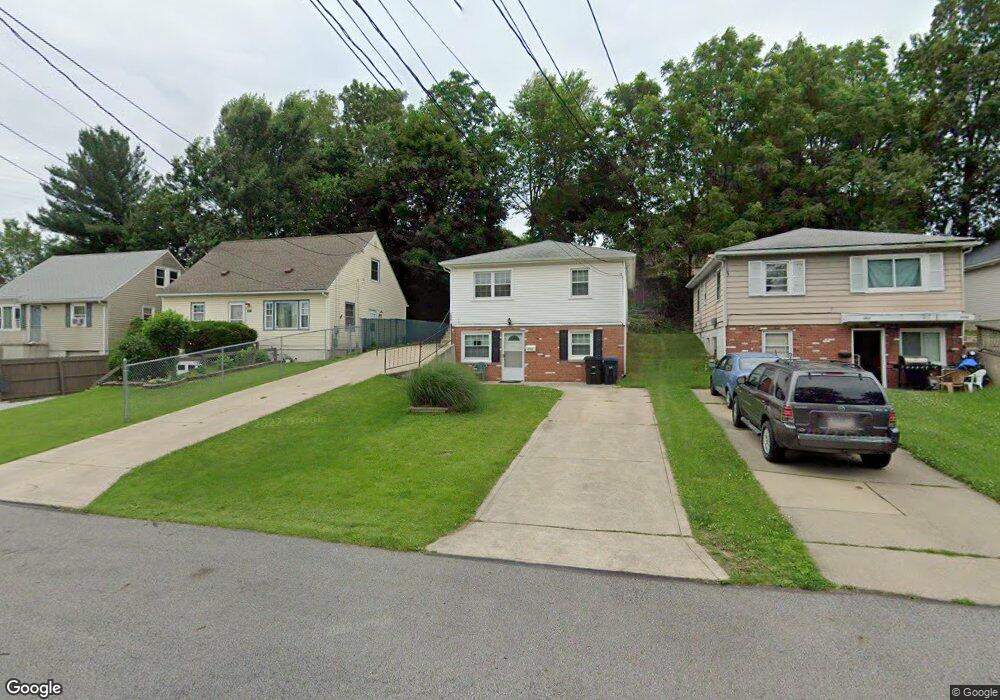
2606 Nesmith Lake Blvd Unit 2608 Akron, OH 44314
Kenmore NeighborhoodEstimated Value: $83,406 - $120,000
3
Beds
2
Baths
768
Sq Ft
$134/Sq Ft
Est. Value
About This Home
This home is located at 2606 Nesmith Lake Blvd Unit 2608, Akron, OH 44314 and is currently estimated at $103,102, approximately $134 per square foot. 2606 Nesmith Lake Blvd Unit 2608 is a home located in Summit County with nearby schools including St. Francis de Sales School and Sam Salem Community Learning Center.
Ownership History
Date
Name
Owned For
Owner Type
Purchase Details
Closed on
May 16, 2022
Sold by
Joliat Renee L
Bought by
Hymes Gene
Current Estimated Value
Home Financials for this Owner
Home Financials are based on the most recent Mortgage that was taken out on this home.
Original Mortgage
$71,250
Outstanding Balance
$67,819
Interest Rate
5.63%
Mortgage Type
New Conventional
Estimated Equity
$35,284
Purchase Details
Closed on
May 13, 2022
Sold by
Joliat Renee L
Bought by
Hymes Gene
Home Financials for this Owner
Home Financials are based on the most recent Mortgage that was taken out on this home.
Original Mortgage
$71,250
Outstanding Balance
$67,819
Interest Rate
5.63%
Mortgage Type
New Conventional
Estimated Equity
$35,284
Purchase Details
Closed on
Jun 13, 2003
Sold by
Ray Scott W
Bought by
Wix Renee L
Home Financials for this Owner
Home Financials are based on the most recent Mortgage that was taken out on this home.
Original Mortgage
$80,240
Interest Rate
5.71%
Mortgage Type
FHA
Purchase Details
Closed on
Apr 26, 1996
Sold by
Horning Joseph A
Bought by
Ray Scott W
Create a Home Valuation Report for This Property
The Home Valuation Report is an in-depth analysis detailing your home's value as well as a comparison with similar homes in the area
Home Values in the Area
Average Home Value in this Area
Purchase History
| Date | Buyer | Sale Price | Title Company |
|---|---|---|---|
| Hymes Gene | $95,000 | Chicago Title | |
| Hymes Gene | $95,000 | Chicago Title | |
| Wix Renee L | $81,500 | Midland Commerce Group | |
| Ray Scott W | $20,000 | -- |
Source: Public Records
Mortgage History
| Date | Status | Borrower | Loan Amount |
|---|---|---|---|
| Open | Hymes Gene | $71,250 | |
| Closed | Hymes Gene | $71,250 | |
| Previous Owner | Wix Renee L | $80,240 |
Source: Public Records
Tax History Compared to Growth
Tax History
| Year | Tax Paid | Tax Assessment Tax Assessment Total Assessment is a certain percentage of the fair market value that is determined by local assessors to be the total taxable value of land and additions on the property. | Land | Improvement |
|---|---|---|---|---|
| 2025 | $1,515 | $27,948 | $7,417 | $20,531 |
| 2024 | $1,515 | $27,948 | $7,417 | $20,531 |
| 2023 | $1,515 | $27,948 | $7,417 | $20,531 |
| 2022 | $1,191 | $17,042 | $4,522 | $12,520 |
| 2021 | $1,192 | $17,042 | $4,522 | $12,520 |
| 2020 | $1,175 | $17,040 | $4,520 | $12,520 |
| 2019 | $1,406 | $17,610 | $4,910 | $12,700 |
| 2018 | $1,389 | $17,610 | $4,910 | $12,700 |
| 2017 | $1,410 | $17,610 | $4,910 | $12,700 |
| 2016 | $1,411 | $17,610 | $4,910 | $12,700 |
| 2015 | $1,410 | $17,610 | $4,910 | $12,700 |
| 2014 | $1,319 | $17,610 | $4,910 | $12,700 |
| 2013 | $1,334 | $18,200 | $4,910 | $13,290 |
Source: Public Records
Map
Nearby Homes
- 2513 Christensen Ave
- 2531 Pelton Ave
- 2785 Nesmith Lake Blvd
- 364 Rexford St
- 363 Lockwood St
- 355 Lockwood St
- 2365 Pelton Ave
- 55 W Ralston Ave
- 451 Allenford St
- 41 W Woodsdale Ave
- 17 W Woodsdale Ave
- 32 Joyce Ave
- 0 Joyce Ave NW Unit 35 5043152
- 0 Joyce Ave NW Unit 34 5043158
- 590 Flora Ave
- 2984 Manchester Rd
- 636 Flora Ave
- 40 E Dresden Ave
- 23 Selden Ave
- 37 Selden Ave
- 2612 Nesmith Lake Blvd
- 2602 Nesmith Lake Blvd Unit 2604
- 2606 2608 Nesmith Lake Blvd
- 2616 Nesmith Lake Blvd
- 2600 Nesmith Lake Blvd
- 2597 Christensen Ave
- 2593 Christensen Ave
- 2620 Nesmith Lake Blvd
- 2609 Nesmith Lake Blvd
- 2596 Nesmith Lake Blvd
- 2583 Christensen Ave
- 2607 Christensen Ave
- 2626 Nesmith Lake Blvd
- 2619 Nesmith Lake Blvd
- 2601 Nesmith Lake Blvd
- 2579 Christensen Ave
- 2590 Nesmith Lake Blvd
- 2613 Christensen Ave Unit 2615
- 2595 Nesmith Lake Blvd
- 2625 Nesmith Lake Blvd