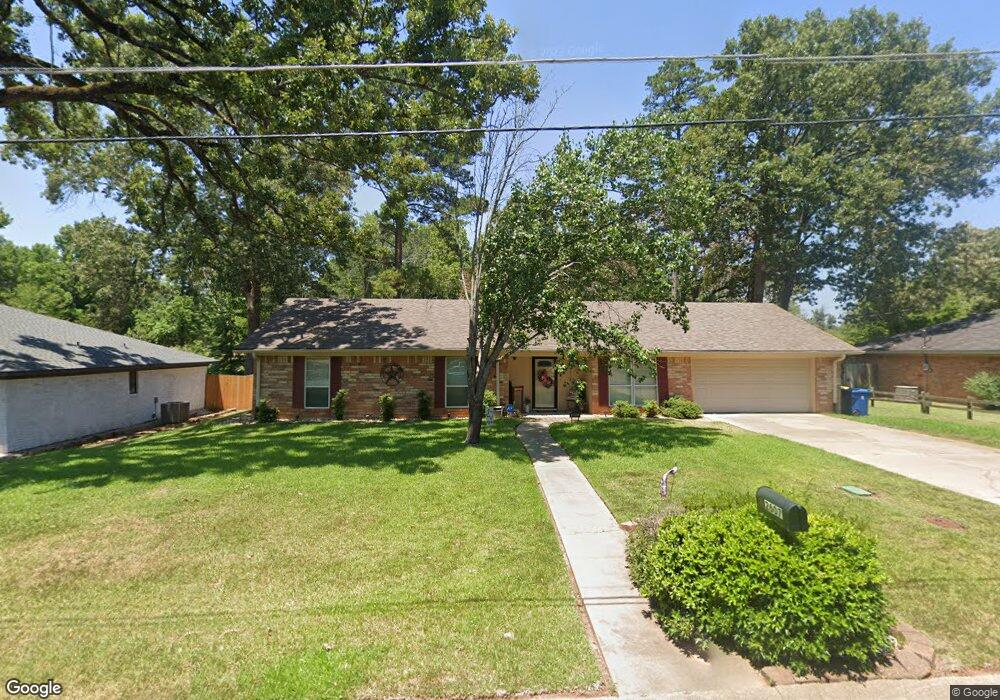
2607 Aspen St Kilgore, TX 75662
Estimated Value: $219,274 - $244,000
--
Bed
--
Bath
1,772
Sq Ft
$133/Sq Ft
Est. Value
About This Home
This home is located at 2607 Aspen St, Kilgore, TX 75662 and is currently estimated at $235,319, approximately $132 per square foot. 2607 Aspen St is a home located in Rusk County with nearby schools including Kilgore Primary School, Chandler Elementary School, and Kilgore Intermediate School.
Ownership History
Date
Name
Owned For
Owner Type
Purchase Details
Closed on
Jun 5, 2009
Sold by
Mobbs Investments Inc
Bought by
Starkey Nancy
Current Estimated Value
Purchase Details
Closed on
Oct 16, 2008
Sold by
Thompson Jimmy and Thompson Amy
Bought by
Mobbs Investment Inc
Purchase Details
Closed on
May 31, 2006
Sold by
Walden Kathryn
Bought by
Thompson Jimmy and Thompson Amy
Home Financials for this Owner
Home Financials are based on the most recent Mortgage that was taken out on this home.
Original Mortgage
$90,000
Interest Rate
8.62%
Mortgage Type
Adjustable Rate Mortgage/ARM
Purchase Details
Closed on
Jan 12, 2005
Sold by
Truitt Alan D and Truitt Tonya L
Bought by
Walden Kathryn
Create a Home Valuation Report for This Property
The Home Valuation Report is an in-depth analysis detailing your home's value as well as a comparison with similar homes in the area
Home Values in the Area
Average Home Value in this Area
Purchase History
| Date | Buyer | Sale Price | Title Company |
|---|---|---|---|
| Starkey Nancy | -- | None Available | |
| Mobbs Investment Inc | -- | -- | |
| Thompson Jimmy | -- | -- | |
| Walden Kathryn | -- | None Available |
Source: Public Records
Mortgage History
| Date | Status | Borrower | Loan Amount |
|---|---|---|---|
| Previous Owner | Thompson Jimmy | $90,000 |
Source: Public Records
Tax History Compared to Growth
Tax History
| Year | Tax Paid | Tax Assessment Tax Assessment Total Assessment is a certain percentage of the fair market value that is determined by local assessors to be the total taxable value of land and additions on the property. | Land | Improvement |
|---|---|---|---|---|
| 2024 | $4,476 | $220,120 | $30,000 | $190,120 |
| 2023 | $4,008 | $202,380 | $30,000 | $172,380 |
| 2022 | $4,029 | $177,020 | $20,000 | $157,020 |
| 2021 | $3,420 | $134,660 | $20,000 | $114,660 |
| 2020 | $3,320 | $134,690 | $20,000 | $114,690 |
| 2019 | $3,404 | $130,650 | $15,000 | $115,650 |
| 2018 | $3,483 | $130,650 | $15,000 | $115,650 |
| 2017 | $3,363 | $130,650 | $15,000 | $115,650 |
| 2016 | $3,363 | $130,650 | $15,000 | $115,650 |
| 2015 | -- | $130,650 | $15,000 | $115,650 |
| 2014 | -- | $123,760 | $15,000 | $108,760 |
Source: Public Records
Map
Nearby Homes