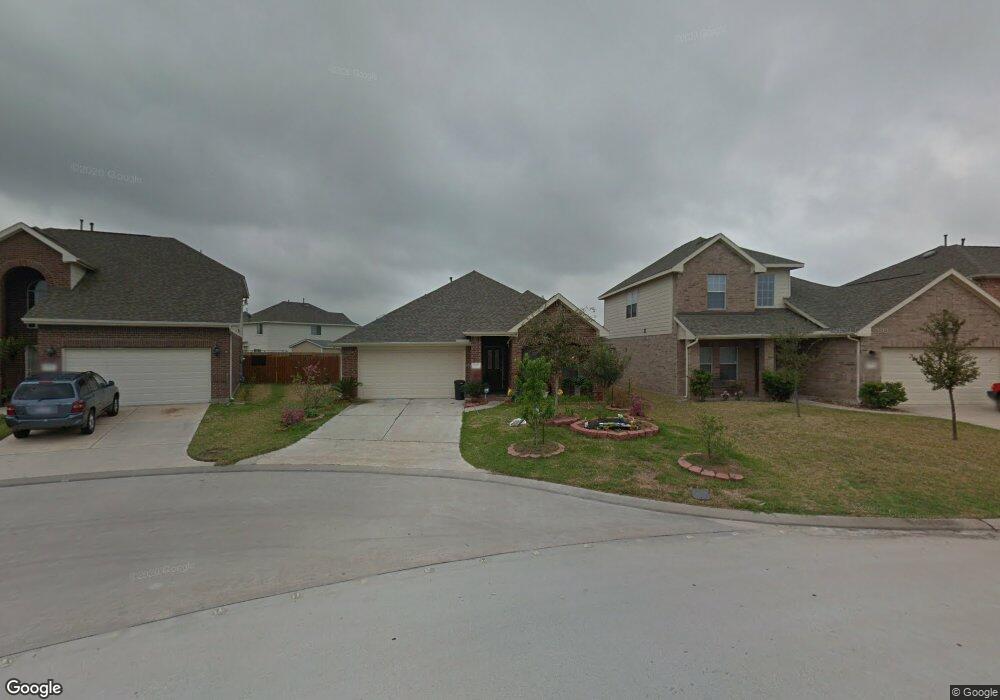
2607 Royal Thistle Dr Houston, TX 77088
North Houston NeighborhoodEstimated Value: $246,688 - $263,000
3
Beds
2
Baths
1,762
Sq Ft
$144/Sq Ft
Est. Value
About This Home
This home is located at 2607 Royal Thistle Dr, Houston, TX 77088 and is currently estimated at $253,672, approximately $143 per square foot. 2607 Royal Thistle Dr is a home located in Harris County with nearby schools including Hill Intermediate School, Stovall School, and Carmichael Elementary School.
Ownership History
Date
Name
Owned For
Owner Type
Purchase Details
Closed on
May 16, 2022
Sold by
Vuong Thai A and Thi Hang
Bought by
Son Trung and Nguyen Lieu
Current Estimated Value
Purchase Details
Closed on
May 9, 2022
Sold by
Thi-Mai Nguyen Phuong
Bought by
Vuong Thai Anh
Purchase Details
Closed on
Mar 12, 2022
Sold by
Vo Bich-Loan T and Vo Thai A
Bought by
Vuong Thai A
Purchase Details
Closed on
Nov 17, 2014
Sold by
Lennar Homes Of Texas Land And Construct
Bought by
Lennar Homes Of Texas Sales And Marketin
Purchase Details
Closed on
Jan 11, 2007
Sold by
Lennar Homes Of Texas
Bought by
Vo Bich Loan T and Vuong Thai A
Home Financials for this Owner
Home Financials are based on the most recent Mortgage that was taken out on this home.
Original Mortgage
$107,950
Interest Rate
6.1%
Mortgage Type
Purchase Money Mortgage
Create a Home Valuation Report for This Property
The Home Valuation Report is an in-depth analysis detailing your home's value as well as a comparison with similar homes in the area
Home Values in the Area
Average Home Value in this Area
Purchase History
| Date | Buyer | Sale Price | Title Company |
|---|---|---|---|
| Son Trung | -- | None Listed On Document | |
| Vuong Thai Anh | -- | None Listed On Document | |
| Vuong Thai A | -- | None Listed On Document | |
| Lennar Homes Of Texas Sales And Marketin | -- | North American Title Co | |
| Vo Bich Loan T | -- | None Available | |
| Lennar Homes Of Texas Sales & Mktg Ltd | -- | None Available |
Source: Public Records
Mortgage History
| Date | Status | Borrower | Loan Amount |
|---|---|---|---|
| Previous Owner | Vo Bich Loan T | $107,950 |
Source: Public Records
Tax History Compared to Growth
Tax History
| Year | Tax Paid | Tax Assessment Tax Assessment Total Assessment is a certain percentage of the fair market value that is determined by local assessors to be the total taxable value of land and additions on the property. | Land | Improvement |
|---|---|---|---|---|
| 2025 | $4,632 | $252,679 | $45,275 | $207,404 |
| 2024 | $4,632 | $252,679 | $45,275 | $207,404 |
| 2023 | $4,632 | $269,269 | $45,275 | $223,994 |
| 2022 | $5,400 | $234,622 | $26,558 | $208,064 |
| 2021 | $5,102 | $195,096 | $26,558 | $168,538 |
| 2020 | $5,125 | $184,259 | $26,558 | $157,701 |
| 2019 | $4,931 | $170,109 | $25,294 | $144,815 |
| 2018 | $1,891 | $163,580 | $25,294 | $138,286 |
| 2017 | $4,041 | $163,580 | $25,294 | $138,286 |
| 2016 | $3,674 | $146,349 | $18,211 | $128,138 |
| 2015 | $1,954 | $146,349 | $18,211 | $128,138 |
| 2014 | $1,954 | $126,373 | $18,211 | $108,162 |
Source: Public Records
Map
Nearby Homes
- 2634 Royal Blue Dr
- 2647 Royal Thistle Dr
- 11422 Royal Thistle Ct
- 2734 Donellan Dr
- 10923 Whistlers Cottage Ct
- 2507 Estaril Cir
- 2846 W Mount Houston Rd
- 10911 Camarillo Ct
- 2845 Washington Dr
- 11207 Royal Rock Ct
- 9218 Washington Dr
- 9217 Washington Dr
- 9206 Washington Dr
- 11618 Wren Crossing Dr
- 2422 Fallen Pine Ln
- 2418 Fallen Pine Ln
- 2415 Fallen Pine Ln
- 2930 Washington Dr
- 11638 Township Dale Ct
- 10642 Logger Pine Trail Unit B
- 2611 Royal Thistle Dr
- 2603 Royal Thistle Dr
- 2615 Royal Thistle Dr
- 2638 Royal Blue Dr
- 2642 Royal Blue Dr
- 2602 Royal Place Ct
- 2630 Royal Blue Dr
- 2619 Royal Thistle Dr
- 2610 Royal Thistle Dr
- 2606 Royal Place Ct
- 2606 Royal Thistle Dr
- 2646 Royal Blue Dr
- 2626 Royal Blue Dr
- 2623 Royal Thistle Dr
- 2610 Royal Place Ct
- 2614 Royal Thistle Dr
- 2622 Royal Blue Dr
- 2650 Royal Blue Dr
- 2614 Royal Place Ct
- 2618 Royal Thistle Dr